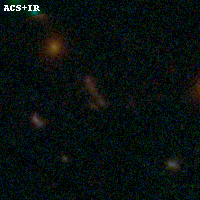
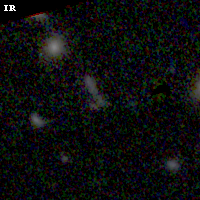
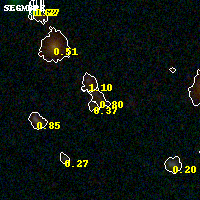
WHL0137-08 IR detection object #12
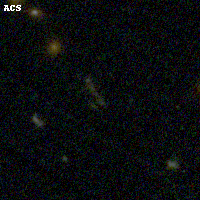
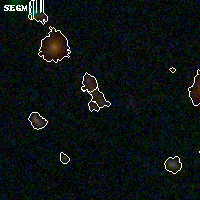
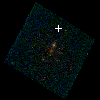
Color images and BPZ results
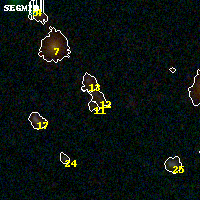
Catalog: 12.cat
Black segments are analyzed here. Roll mouse over color images to view segments.
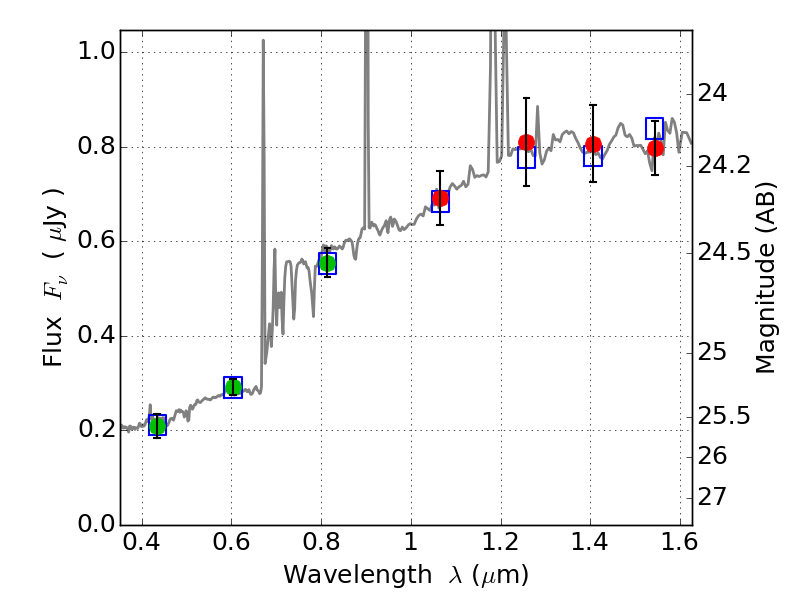
Best viewed in a wide browser window (1200 pixels or more). Download SED & P(z) plots to view larger versions.
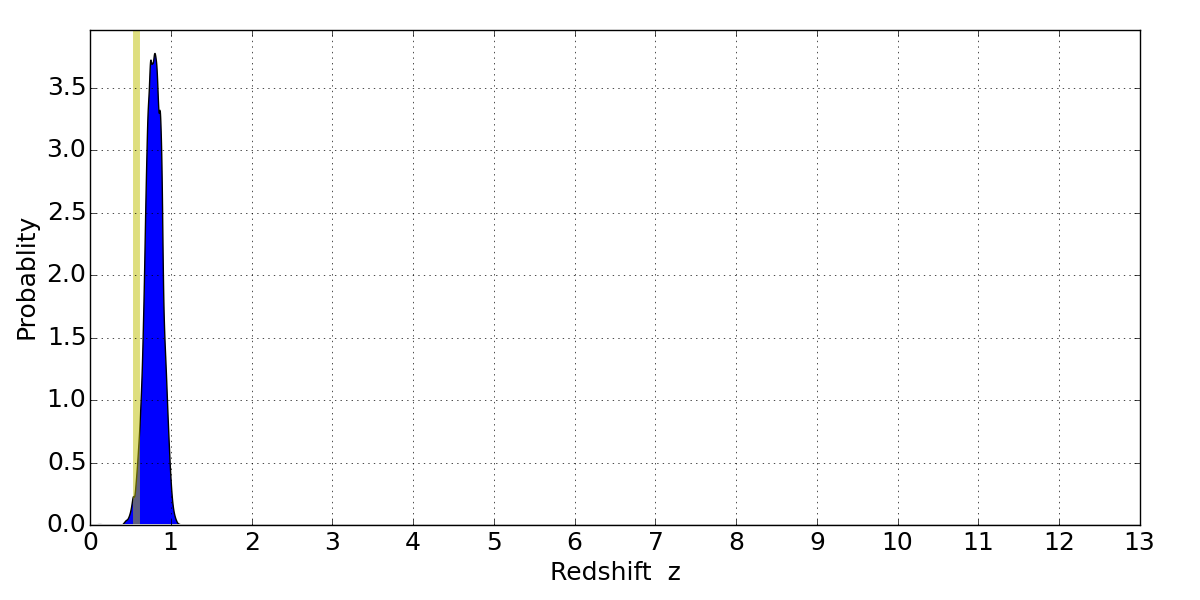
In P(z) plots: Yellow lines mark the cluster redshift z = 0.566,
Object #12 x,y = (2904, 3621) RA, Dec = (01:37:23.496, -8:26:14.28) = (24.34790, -8.43730) BPZ = 0.804 [0.586--0.976] type = 8.70 (SB2_B10 - SB1_B10) chisq2 = 0.11 ODDS = 0.53 z_cluster = 0.566