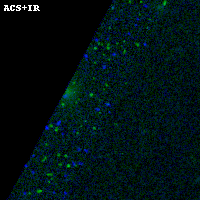
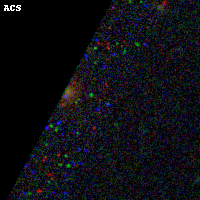
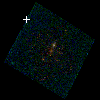
WHL0137-08 ACS+IR detection object #563
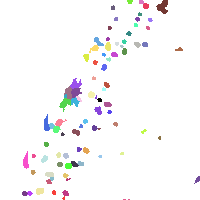
Color images and BPZ results
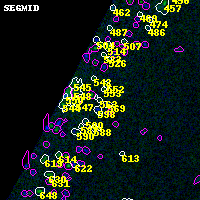
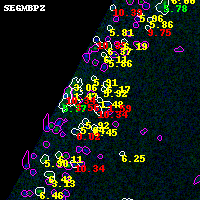
Catalog: 563.cat
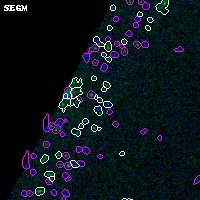
Black segments are analyzed here. Roll mouse over color images to view segments.
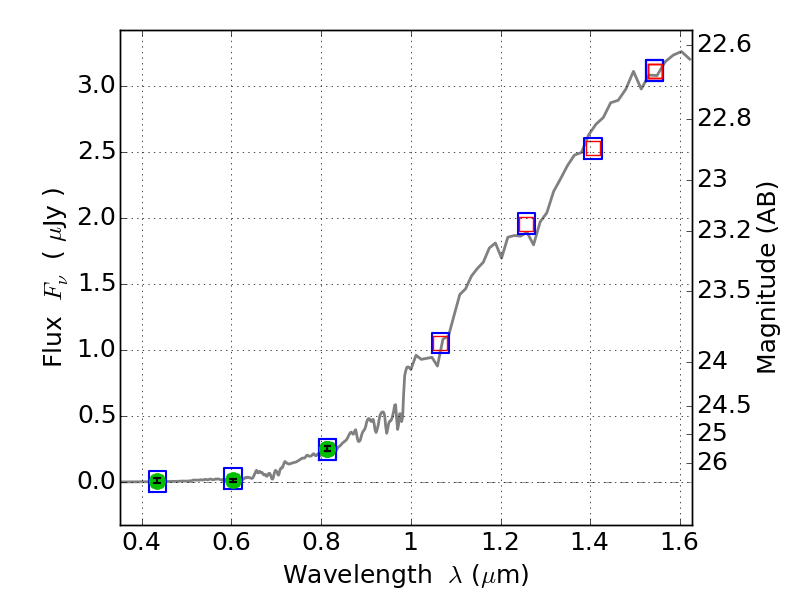
Best viewed in a wide browser window (1200 pixels or more). Download SED & P(z) plots to view larger versions.
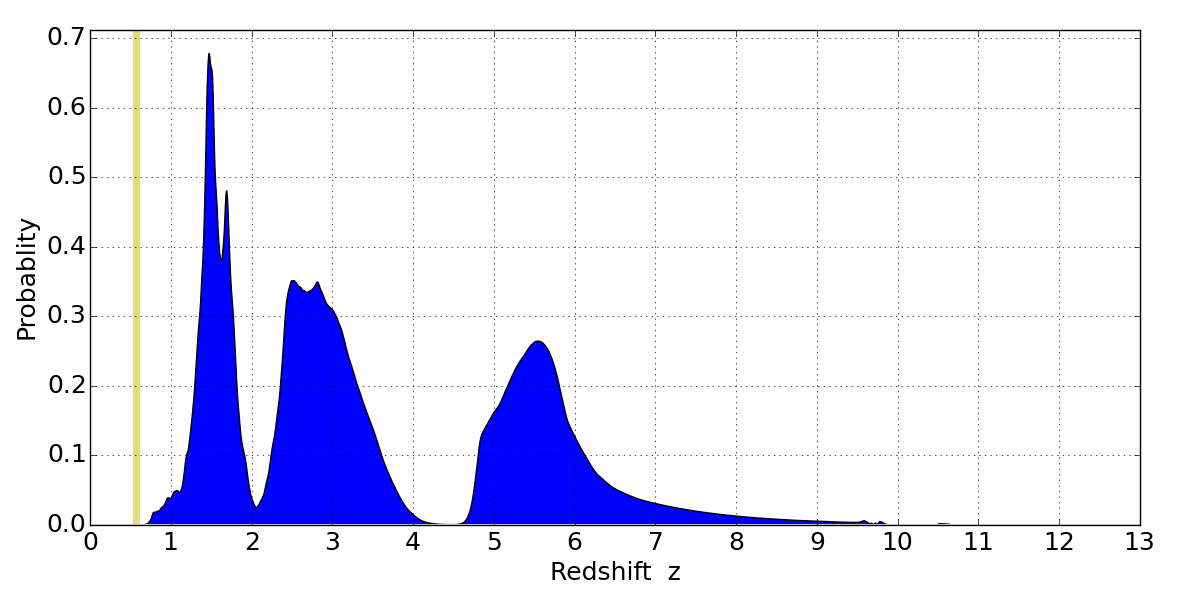
In P(z) plots: Yellow lines mark the cluster redshift z = 0.566,
Object #563 x,y = (1337, 4059) RA, Dec = (01:37:29.832, -8:25:48.00) = (24.37430, -8.43000) BPZ = 1.475 [1.258--7.286] type = 2.00 (Ell6_A_0) chisq2 = 0.01 ODDS = 0.11 z_cluster = 0.566