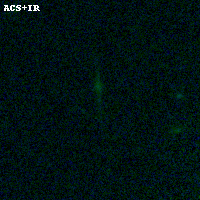
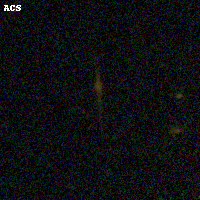
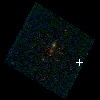
WHL0137-08 ACS+IR detection object #4000
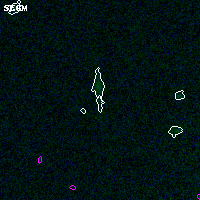
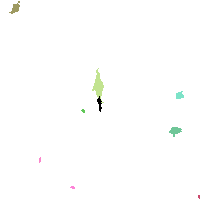
Color images and BPZ results
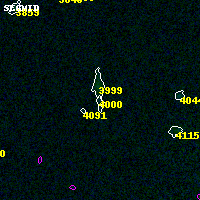
Catalog: 4000.cat
Black segments are analyzed here. Roll mouse over color images to view segments.
Best viewed in a wide browser window (1200 pixels or more). Download SED & P(z) plots to view larger versions.
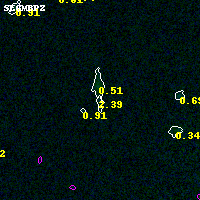
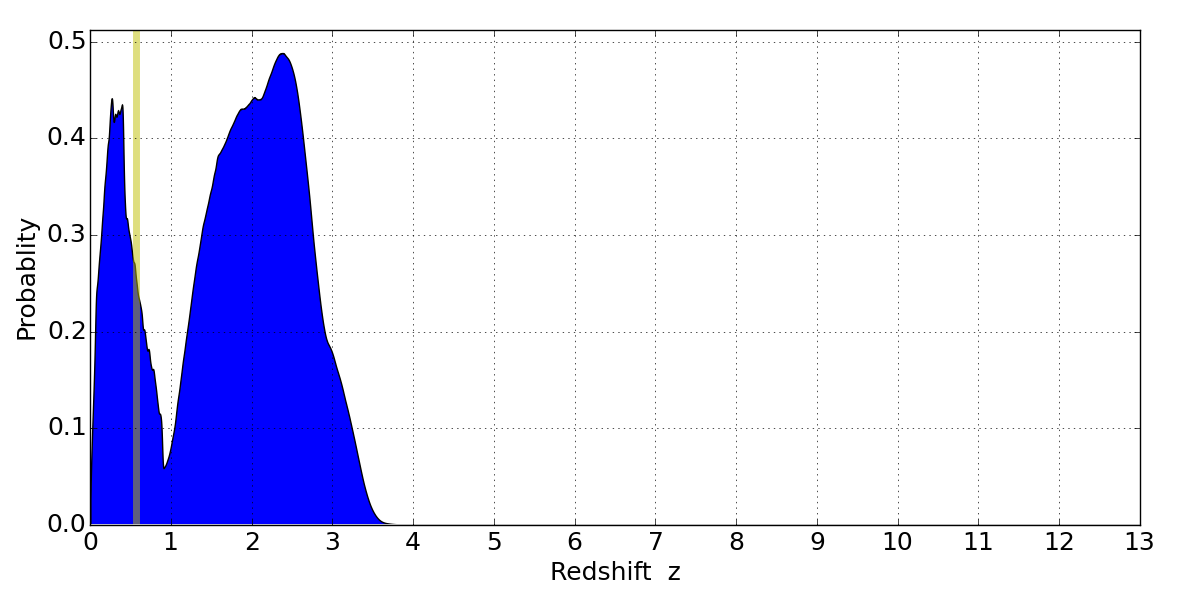
In P(z) plots: Yellow lines mark the cluster redshift z = 0.566,
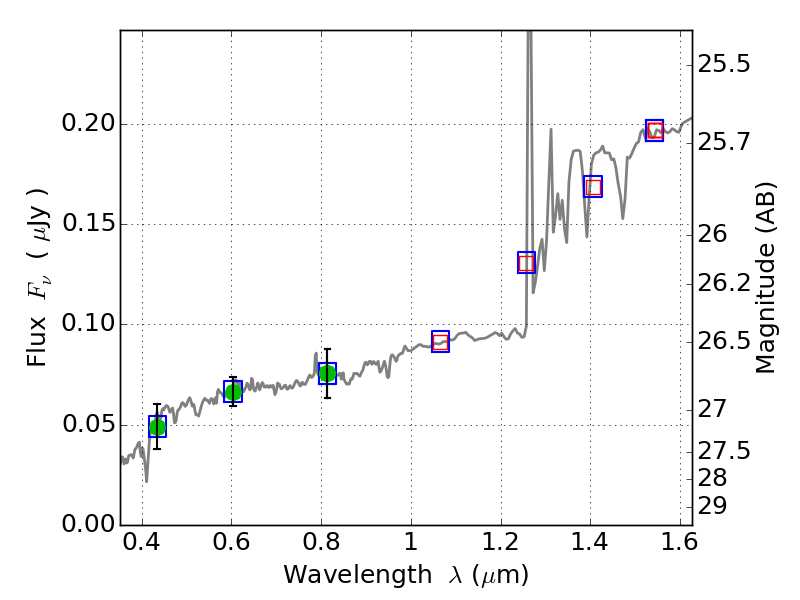
Object #4000 x,y = (3982, 1931) RA, Dec = (01:37:19.128, -8:27:55.80) = (24.32970, -8.46550) BPZ = 2.387 [0.140--3.157] type = 8.70 (SB2_B10 - SB1_B10) chisq2 = 0.00 ODDS = 0.13 z_cluster = 0.566