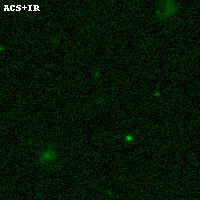
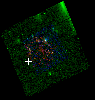
SPT0615-57 ACS+IR detection object #6156
Color images and BPZ results
Catalog: 6156.cat
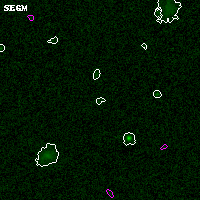
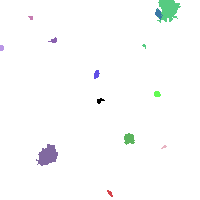
Black segments are analyzed here. Roll mouse over color images to view segments.
Best viewed in a wide browser window (1200 pixels or more). Download SED & P(z) plots to view larger versions.
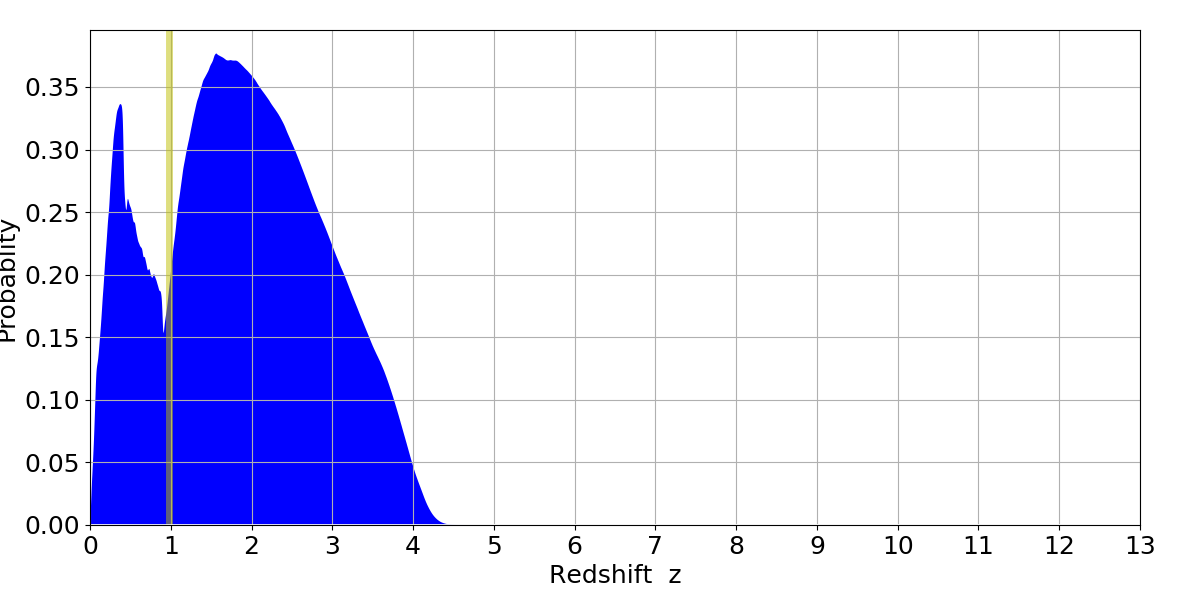
In P(z) plots: Yellow lines mark the cluster redshift z = 0.972,
Object #6156 x,y = (2675, 3733) RA, Dec = (06:16:01.896, -57:47:40.92) = (94.00790, -57.79470) BPZ = 1.564 [0.201--3.757] type = 9.50 (SB3_B10 - SB2_B10) chisq2 = 0.00 ODDS = 0.08 z_cluster = 0.972