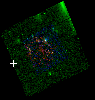
SPT0615-57 ACS+IR detection object #5551
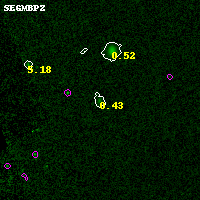
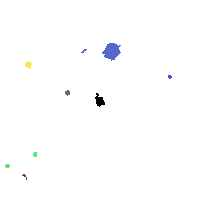
Color images and BPZ results
Catalog: 5551.cat
Black segments are analyzed here. Roll mouse over color images to view segments.
Best viewed in a wide browser window (1200 pixels or more). Download SED & P(z) plots to view larger versions.
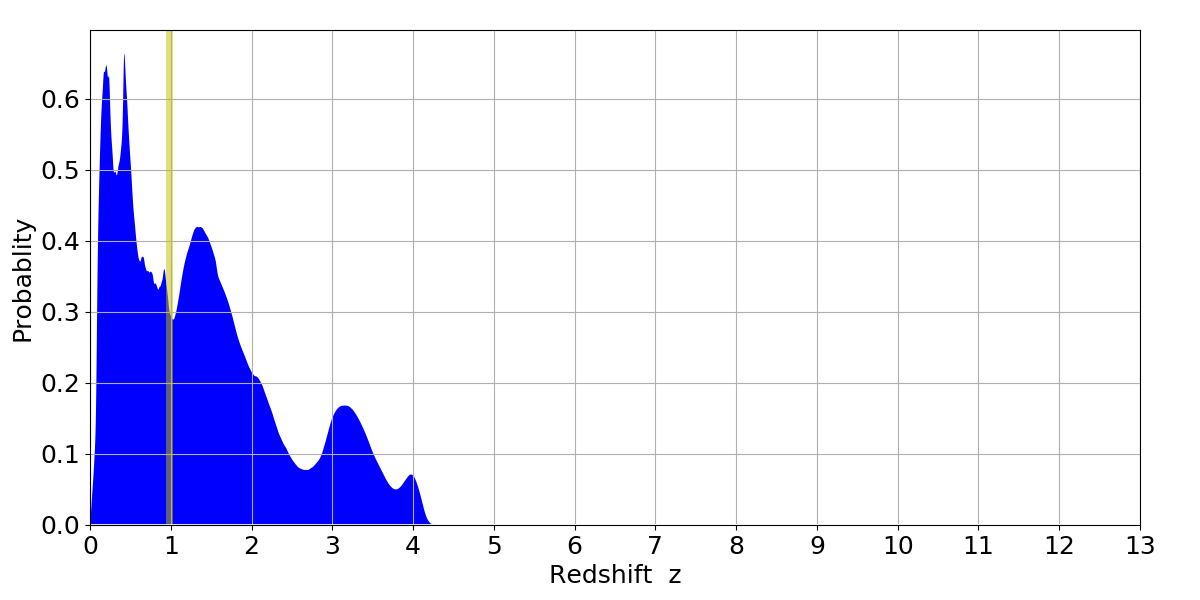
In P(z) plots: Yellow lines mark the cluster redshift z = 0.972,
Object #5551 x,y = (1316, 3516) RA, Dec = (06:16:12.096, -57:47:53.88) = (94.05040, -57.79830) BPZ = 0.426 [0.126--3.703] type = 9.90 (SB3_B10 - SB2_B10) chisq2 = 0.00 ODDS = 0.07 z_cluster = 0.972