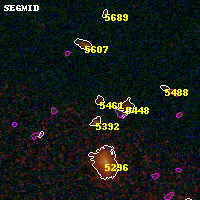
SPT0615-57 ACS+IR detection object #5461
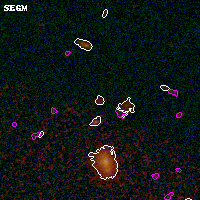
Color images and BPZ results
Catalog: 5461.cat
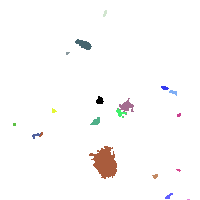
Black segments are analyzed here. Roll mouse over color images to view segments.
Best viewed in a wide browser window (1200 pixels or more). Download SED & P(z) plots to view larger versions.
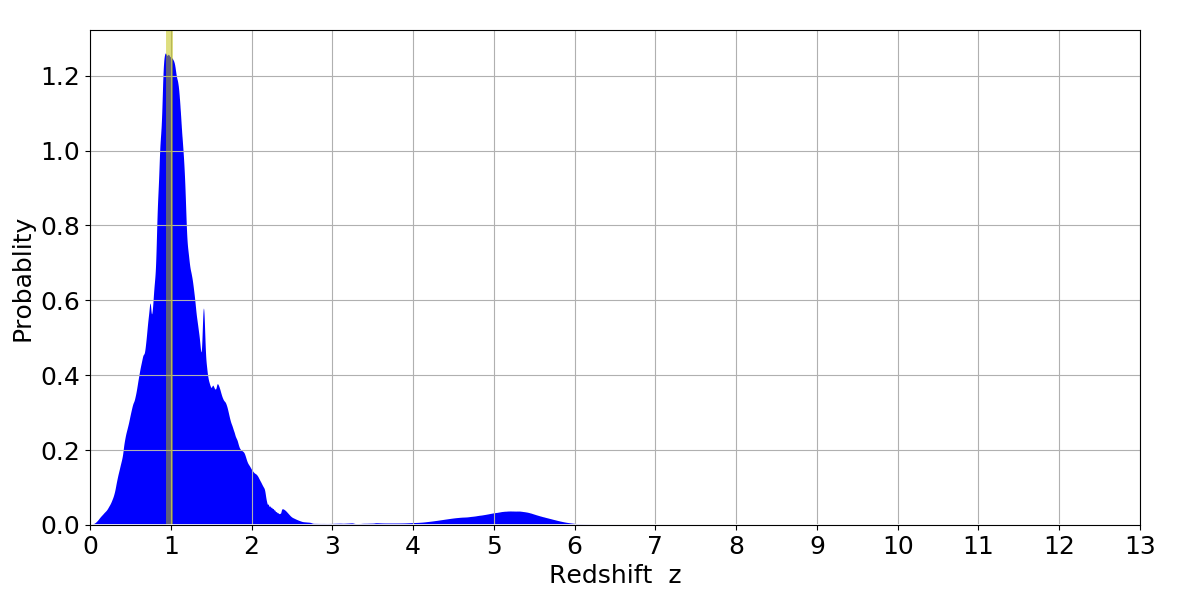
In P(z) plots: Yellow lines mark the cluster redshift z = 0.972,
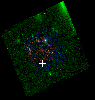
Object #5461 x,y = (4022, 3482) RA, Dec = (06:15:51.792, -57:47:56.04) = (93.96580, -57.79890) BPZ = 0.939 [0.420--4.982] type = 7.60 (SB1_B10 - Scd_B10) chisq2 = 1.79 ODDS = 0.19 z_cluster = 0.972