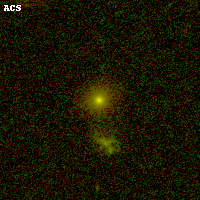
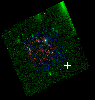
SPT0615-57 ACS+IR detection object #5391
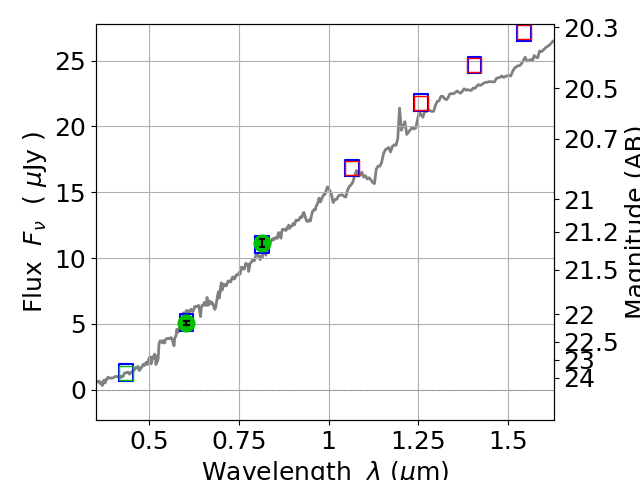
Color images and BPZ results
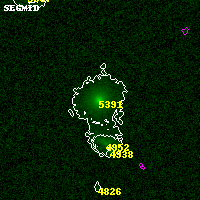
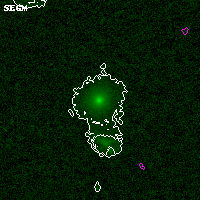
Catalog: 5391.cat
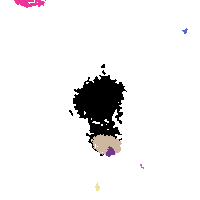
Black segments are analyzed here. Roll mouse over color images to view segments.
Best viewed in a wide browser window (1200 pixels or more). Download SED & P(z) plots to view larger versions.
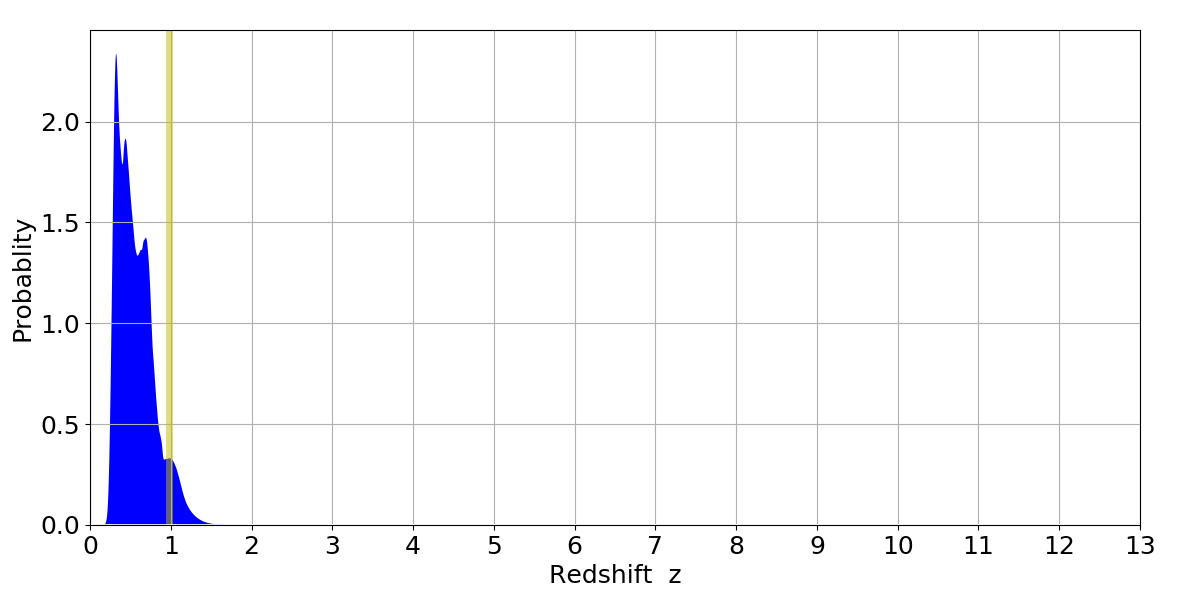
In P(z) plots: Yellow lines mark the cluster redshift z = 0.972,
Object #5391 x,y = (6428, 3352) RA, Dec = (06:15:33.744, -57:48:03.96) = (93.89060, -57.80110) BPZ = 0.324 [0.268--1.115] type = 5.60 (Sbc_B10 - ES0_B10) chisq2 = 0.00 ODDS = 0.21 z_cluster = 0.972