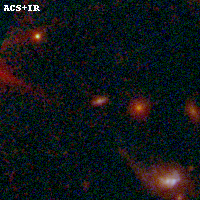
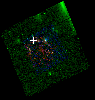
SPT0615-57 ACS+IR detection object #12180
Color images and BPZ results
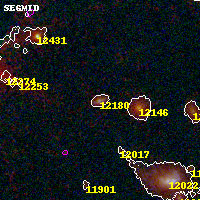
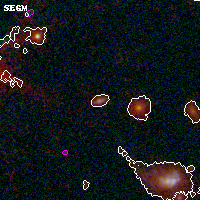
Catalog: 12180.cat
Black segments are analyzed here. Roll mouse over color images to view segments.
Best viewed in a wide browser window (1200 pixels or more). Download SED & P(z) plots to view larger versions.
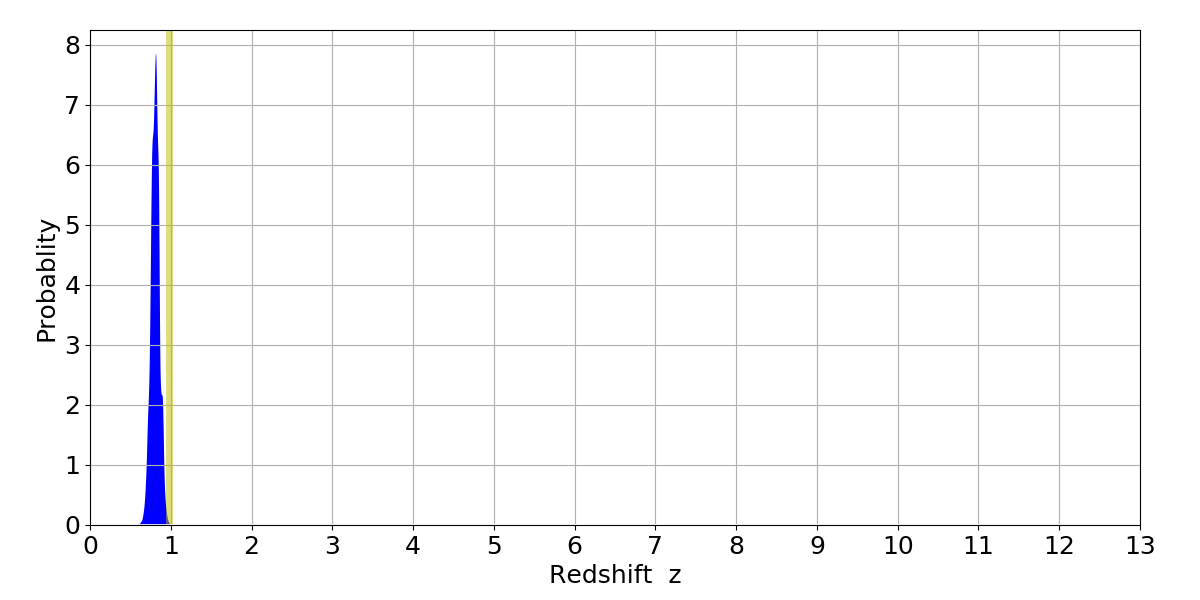
In P(z) plots: Yellow lines mark the cluster redshift z = 0.972,
Object #12180 x,y = (3158, 5654) RA, Dec = (06:15:58.272, -57:45:45.72) = (93.99280, -57.76270) BPZ = 0.817 [0.703--0.915] type = 8.90 (SB2_B10 - SB1_B10) chisq2 = 0.15 ODDS = 0.82 z_cluster = 0.972