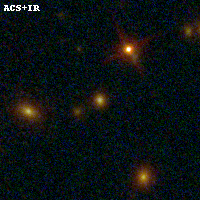
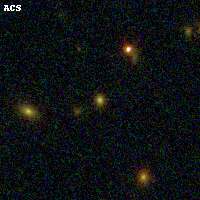
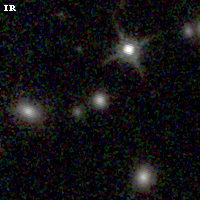
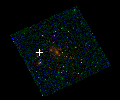
RXC0949+17 IR detection object #502
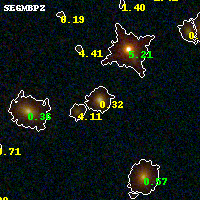
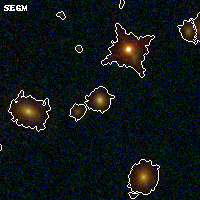
Color images and BPZ results
Catalog: 502.cat
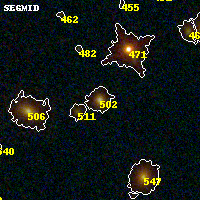
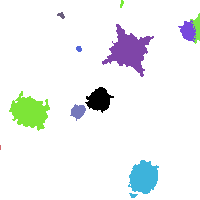
Black segments are analyzed here. Roll mouse over color images to view segments.
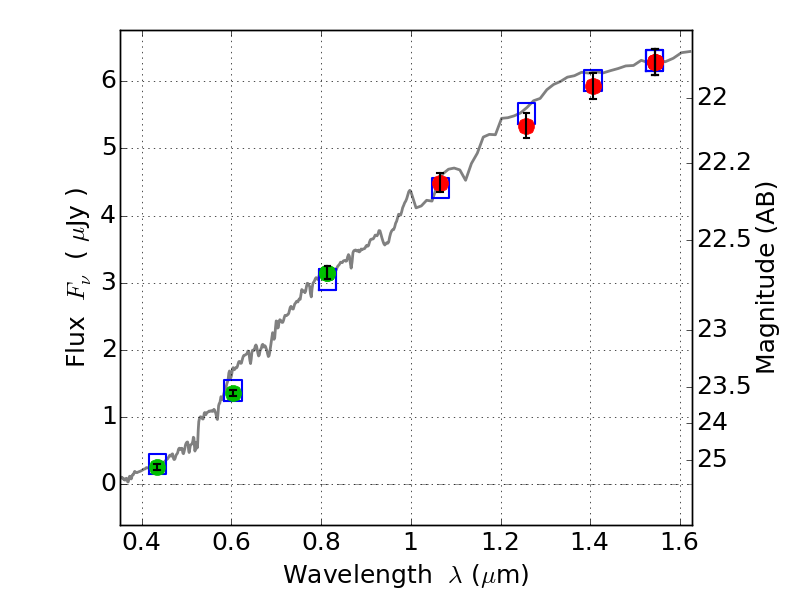
Best viewed in a wide browser window (1200 pixels or more). Download SED & P(z) plots to view larger versions.
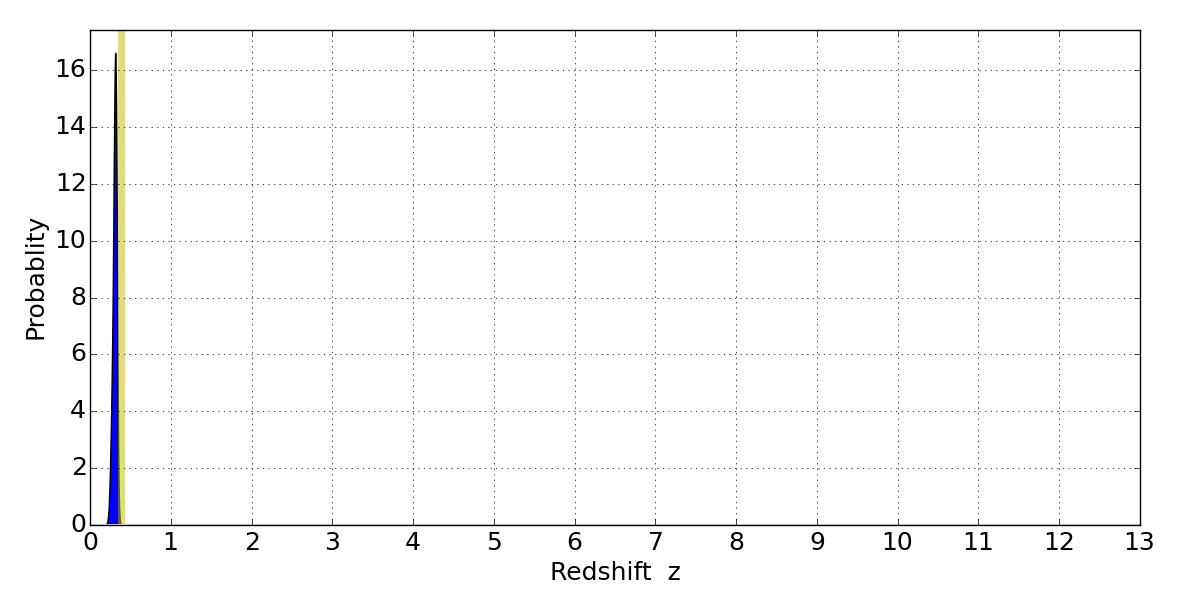
In P(z) plots: Yellow lines mark the cluster redshift z = 0.383,
Object #502 x,y = (1899, 2347) RA, Dec = (09:49:55.296, 17:07:12.00) = (147.48040, 17.12000) BPZ = 0.318 [0.252--0.354] type = 3.60 (Ell4_A_0 - Ell5_A_0) chisq2 = 0.05 ODDS = 0.94 z_cluster = 0.383