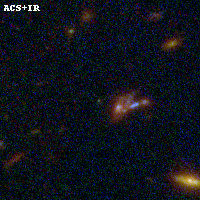
RXC0949+17 IR detection object #10
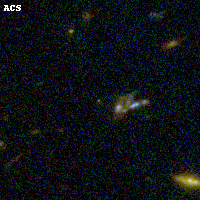
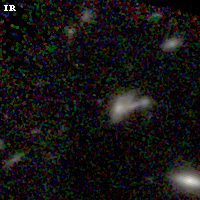
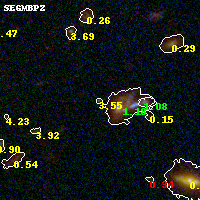
Color images and BPZ results
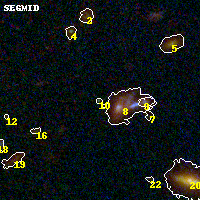
Catalog: 10.cat
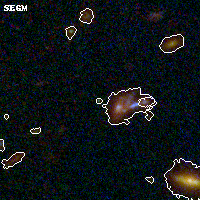
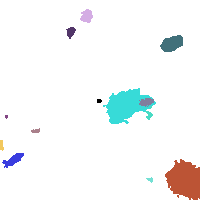
Black segments are analyzed here. Roll mouse over color images to view segments.
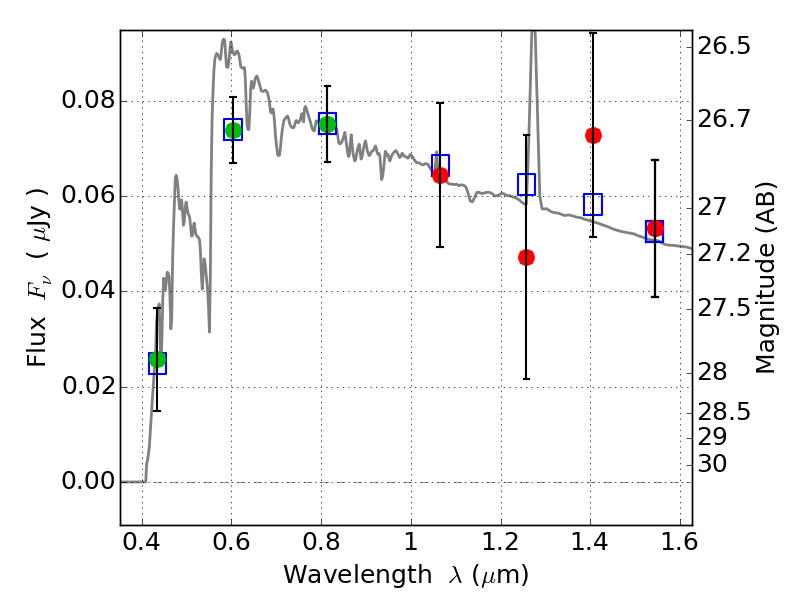
Best viewed in a wide browser window (1200 pixels or more). Download SED & P(z) plots to view larger versions.
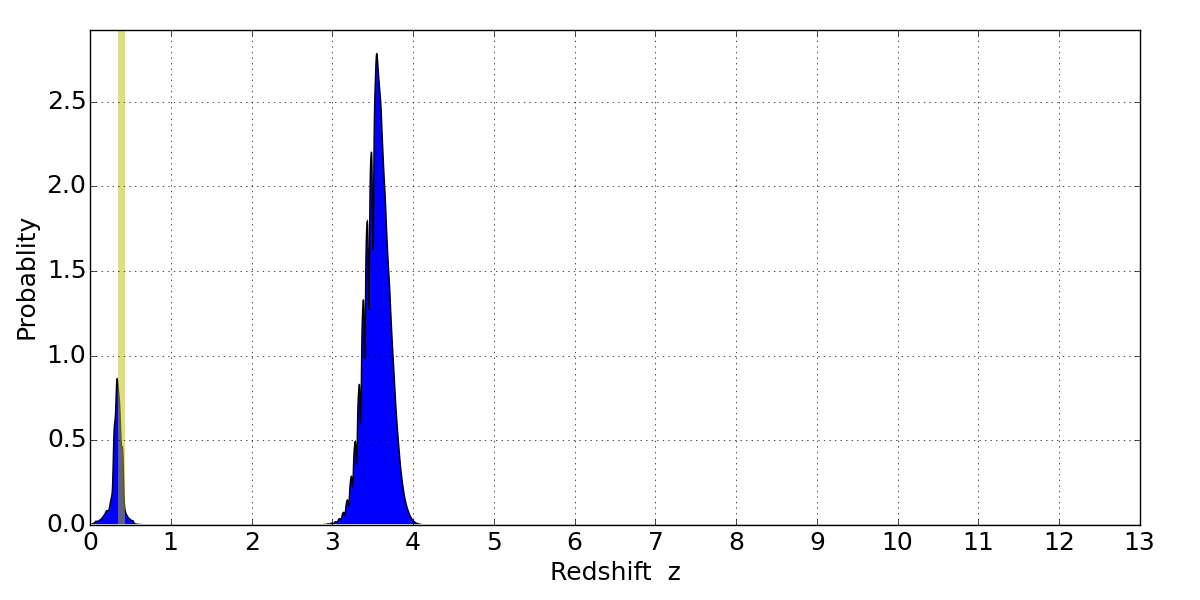
In P(z) plots: Yellow lines mark the cluster redshift z = 0.383,
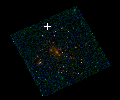
Object #10 x,y = (2271, 3570) RA, Dec = (09:49:53.736, 17:08:25.44) = (147.47390, 17.14040) BPZ = 3.551 [0.301--3.837] type = 10.50 (SB11_A_0_l - SB3_B10) chisq2 = 0.11 ODDS = 0.70 z_cluster = 0.383