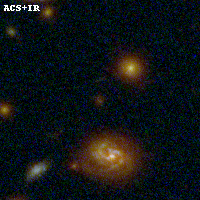
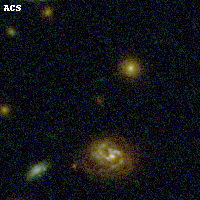
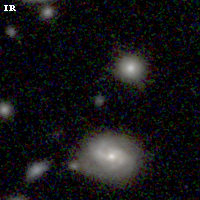
RXC0949+17 IR detection object #50
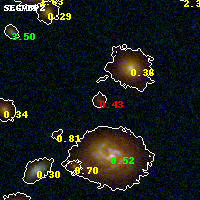
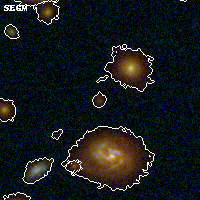
Color images and BPZ results
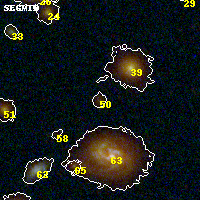
Catalog: 50.cat
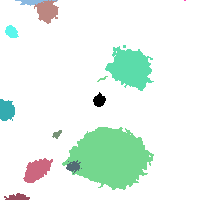
Black segments are analyzed here. Roll mouse over color images to view segments.
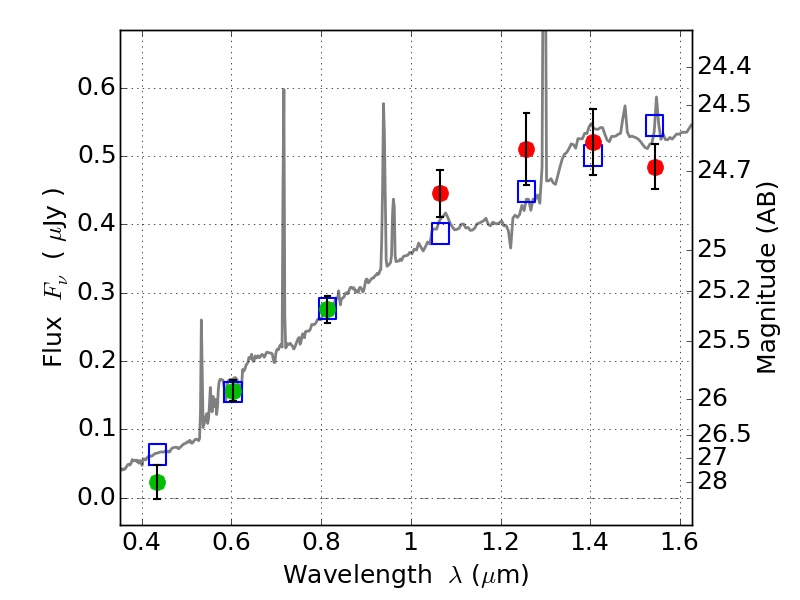
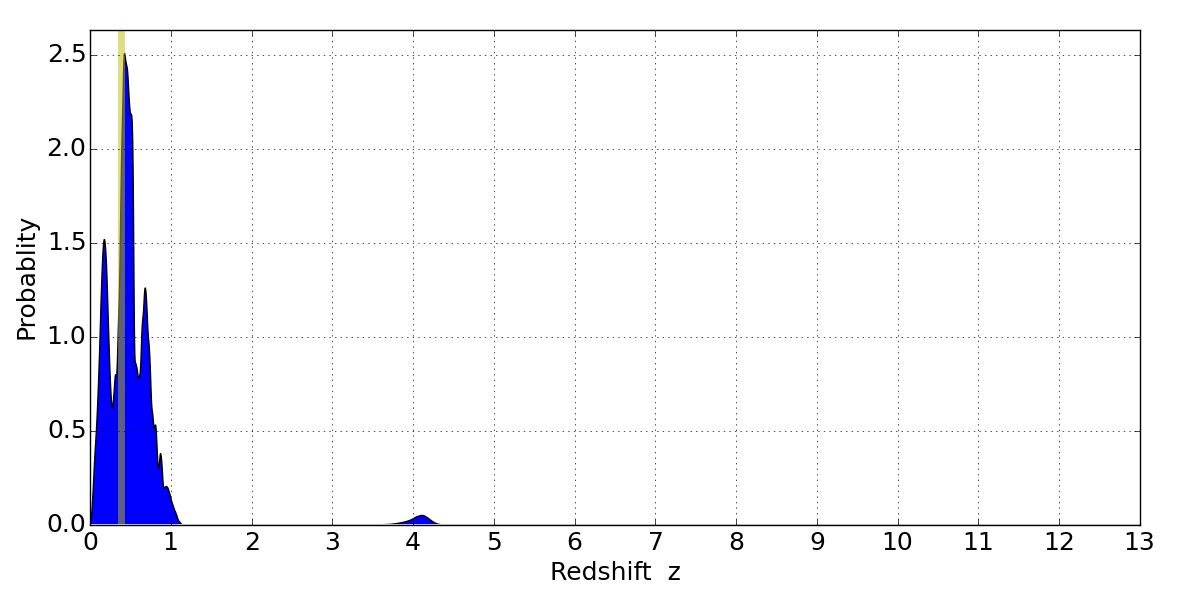
Best viewed in a wide browser window (1200 pixels or more). Download SED & P(z) plots to view larger versions.
In P(z) plots: Yellow lines mark the cluster redshift z = 0.383,
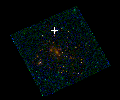
Object #50 x,y = (2646, 3363) RA, Dec = (09:49:52.176, 17:08:13.20) = (147.46740, 17.13700) BPZ = 0.428 [0.093--0.990] type = 7.00 (Scd_B10) chisq2 = 1.18 ODDS = 0.26 z_cluster = 0.383