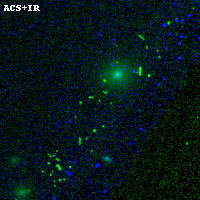
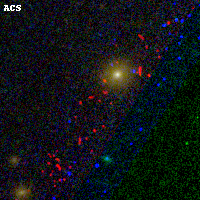
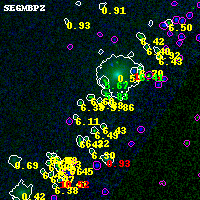
RXC0032+18 ACS+IR detection object #5011
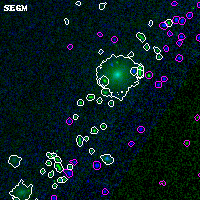
Color images and BPZ results
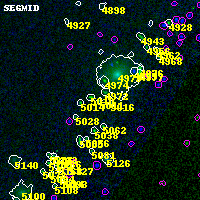
Catalog: 5011.cat
Black segments are analyzed here. Roll mouse over color images to view segments.
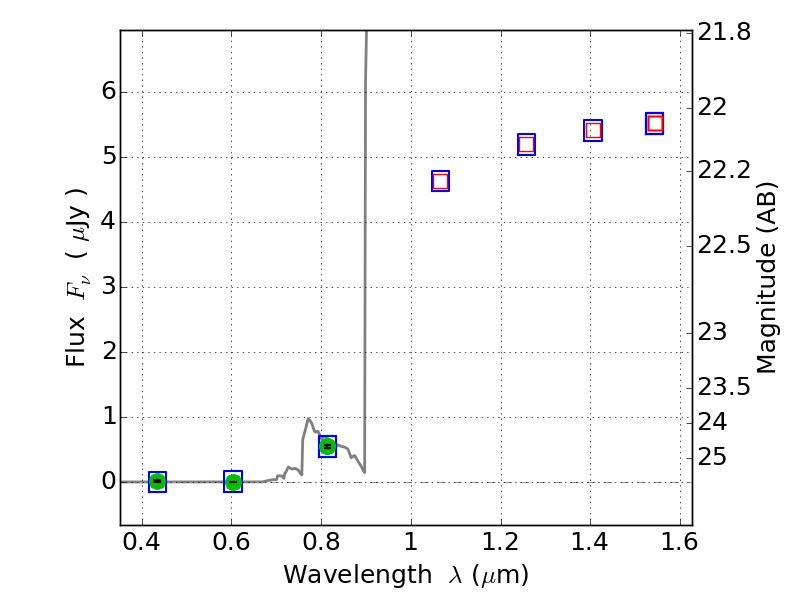
Best viewed in a wide browser window (1200 pixels or more). Download SED & P(z) plots to view larger versions.
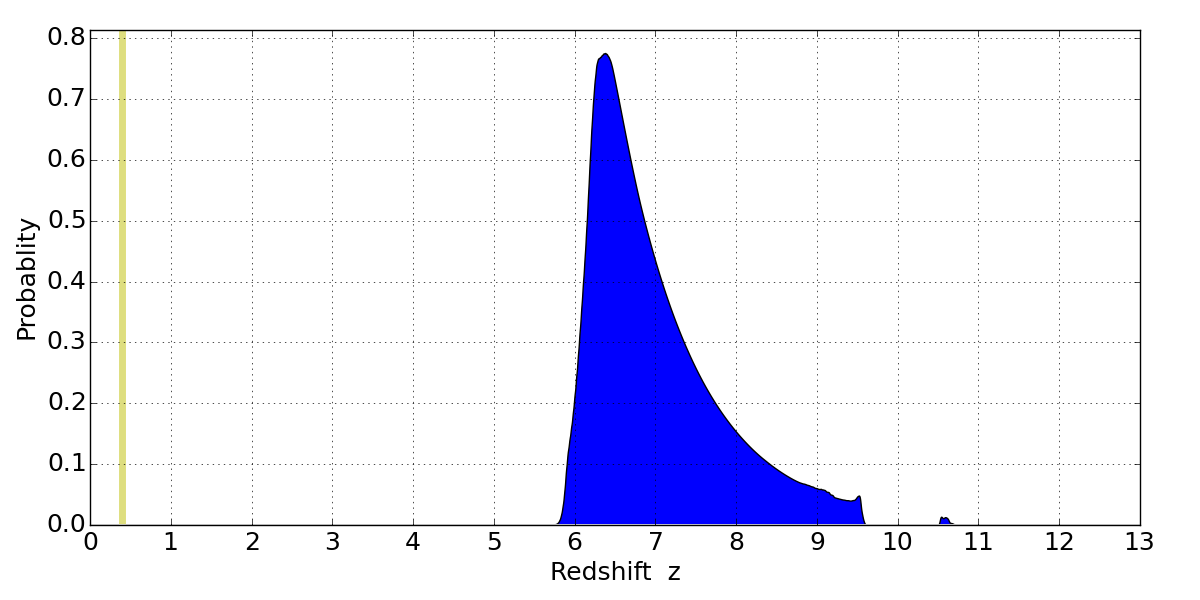
In P(z) plots: Yellow lines mark the cluster redshift z = 0.396,
Object #5011 x,y = (3756, 1260) RA, Dec = (00:32:05.976, 18:06:38.52) = (8.02490, 18.11070) BPZ = 6.384 [6.031--9.048] type = 9.00 (SB2_B10) chisq2 = 0.00 ODDS = 0.40 z_cluster = 0.396