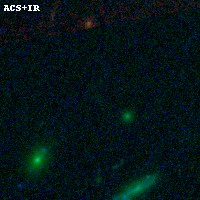
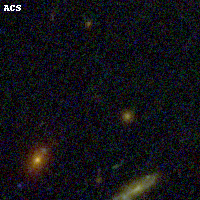
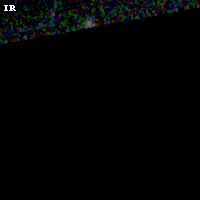
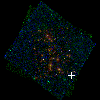
RXC0032+18 ACS+IR detection object #5000
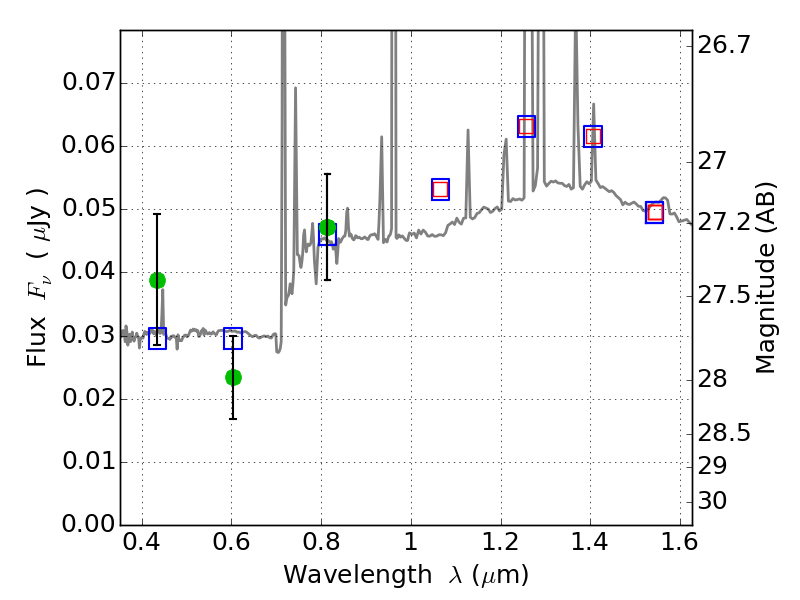
Color images and BPZ results
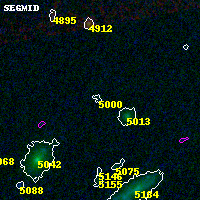
Catalog: 5000.cat
Black segments are analyzed here. Roll mouse over color images to view segments.
Best viewed in a wide browser window (1200 pixels or more). Download SED & P(z) plots to view larger versions.
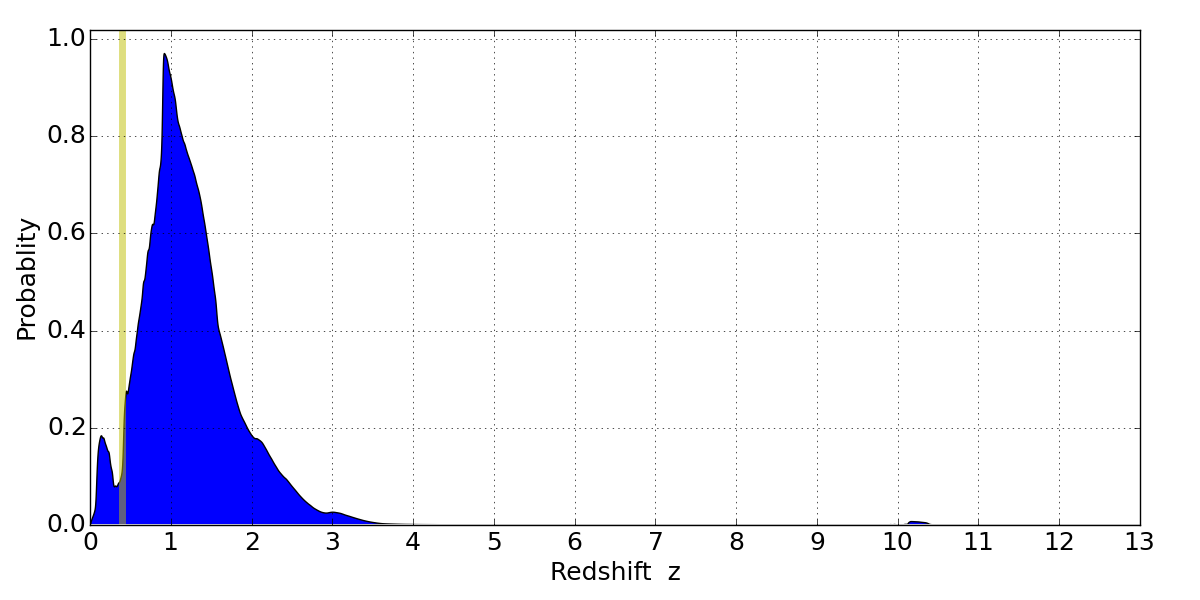
In P(z) plots: Yellow lines mark the cluster redshift z = 0.396,
Object #5000 x,y = (3555, 1270) RA, Dec = (00:32:06.816, 18:06:38.88) = (8.02840, 18.11080) BPZ = 0.921 [0.222--2.606] type = 9.80 (SB3_B10 - SB2_B10) chisq2 = 1.33 ODDS = 0.14 z_cluster = 0.396