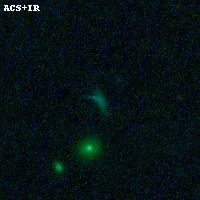
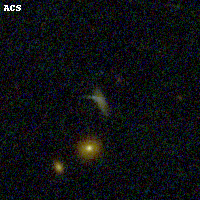
RXC0032+18 ACS+IR detection object #526
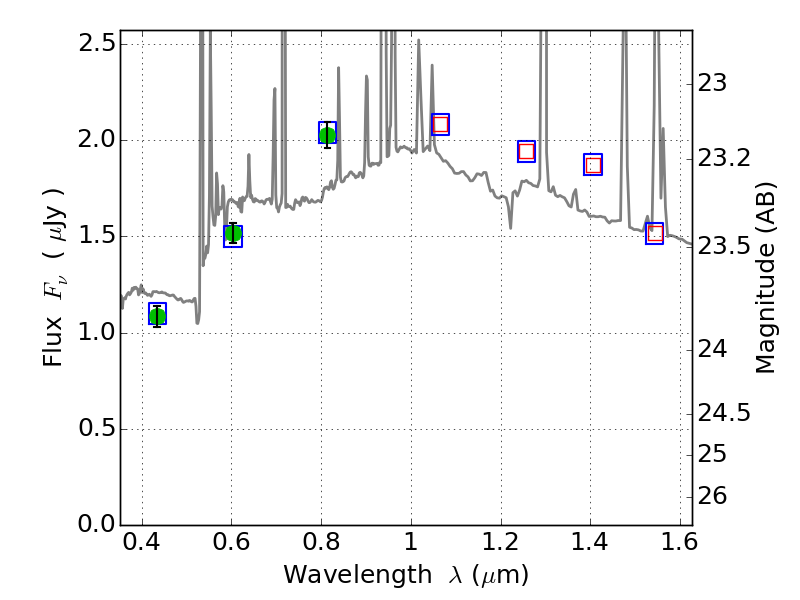
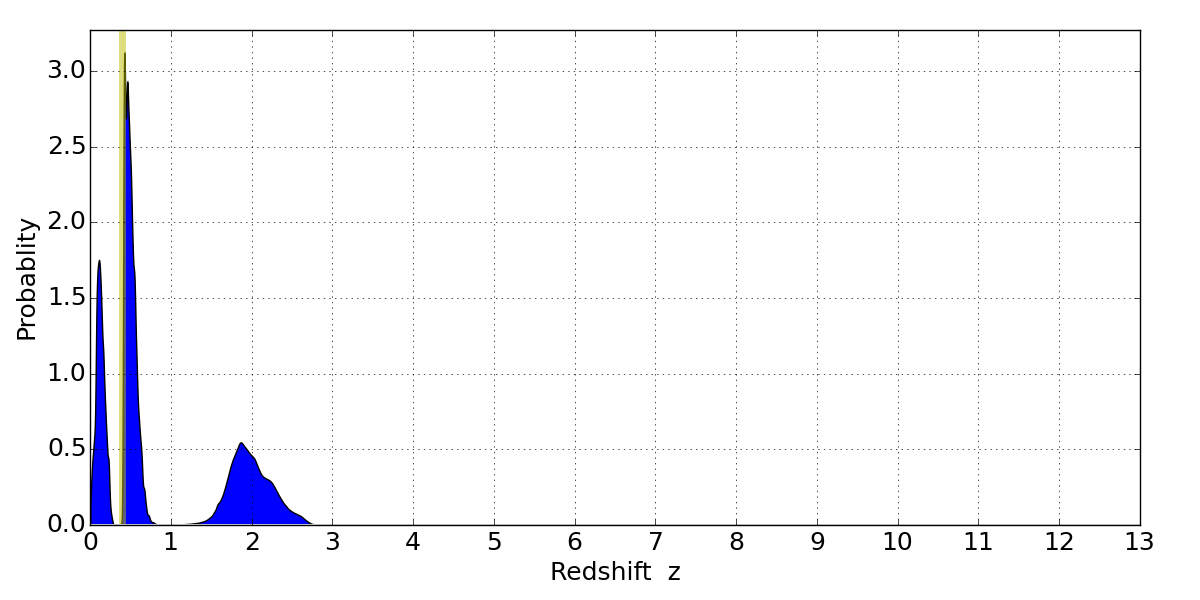
Color images and BPZ results
Catalog: 526.cat
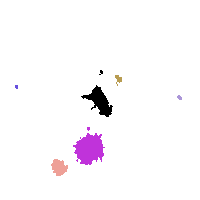
Black segments are analyzed here. Roll mouse over color images to view segments.
Best viewed in a wide browser window (1200 pixels or more). Download SED & P(z) plots to view larger versions.
In P(z) plots: Yellow lines mark the cluster redshift z = 0.396,
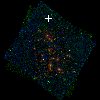
Object #526 x,y = (2418, 4136) RA, Dec = (00:32:11.616, 18:09:30.96) = (8.04840, 18.15860) BPZ = 0.432 [0.067--2.389] type = 9.90 (SB3_B10 - SB2_B10) chisq2 = 0.03 ODDS = 0.22 z_cluster = 0.396