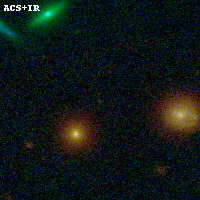
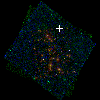
RXC0032+18 ACS+IR detection object #1040
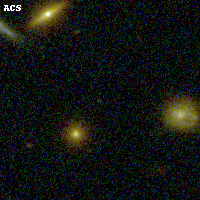
Color images and BPZ results
Catalog: 1040.cat
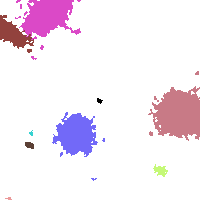
Black segments are analyzed here. Roll mouse over color images to view segments.
Best viewed in a wide browser window (1200 pixels or more). Download SED & P(z) plots to view larger versions.
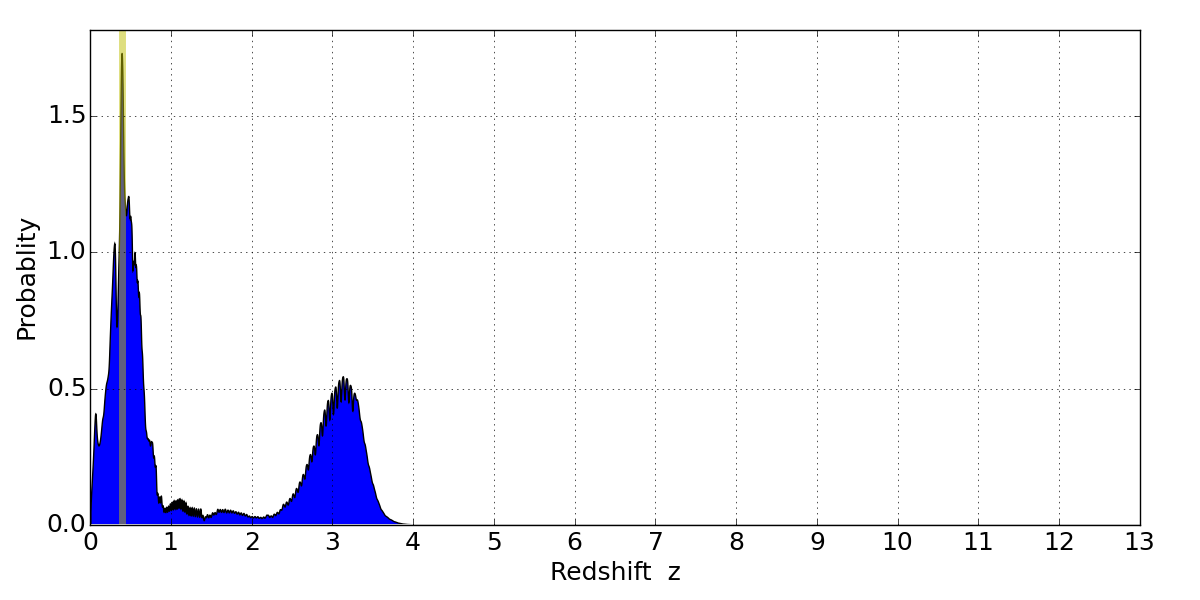
In P(z) plots: Yellow lines mark the cluster redshift z = 0.396,
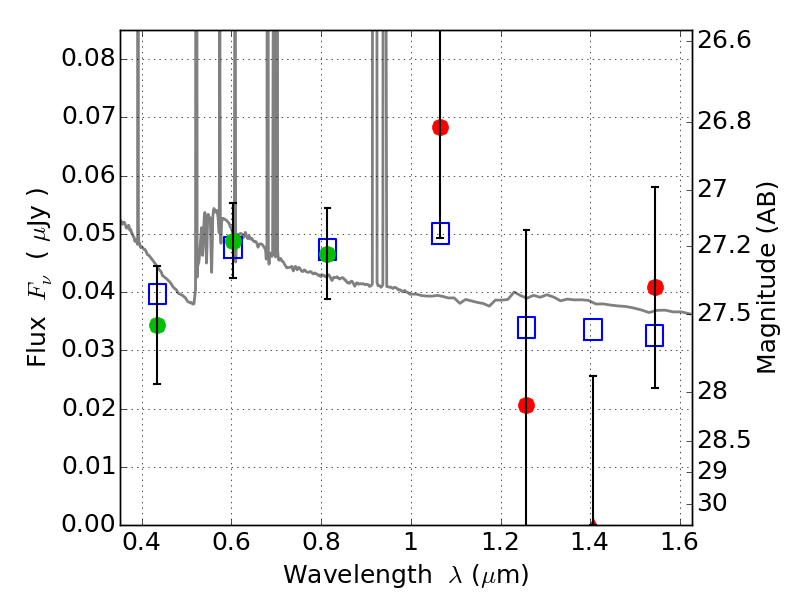
Object #1040 x,y = (2997, 3621) RA, Dec = (00:32:09.168, 18:09:0) = (8.03820, 18.15000) BPZ = 0.397 [0.101--3.454] type = 11.00 (SB11_A_0_l) chisq2 = 0.81 ODDS = 0.14 z_cluster = 0.396