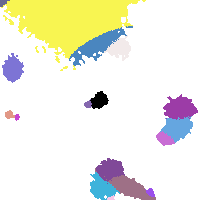
PLCKG282+49 IR detection object #500
Color images and BPZ results
Catalog: 500.cat
Black segments are analyzed here. Roll mouse over color images to view segments.
Best viewed in a wide browser window (1200 pixels or more). Download SED & P(z) plots to view larger versions.
In P(z) plots: Yellow lines mark the cluster redshift z = 0.570,
Object #500 x,y = (5256, 4780) RA, Dec = (11:57:57.216, -10:46:08.40) = (179.48840, -10.76900) BPZ = 0.296 [0.133--3.714] type = 6.60 (Scd_B10 - Sbc_B10) chisq2 = 0.71 ODDS = 0.28 z_cluster = 0.570