PLCKG282+49 IR detection object #100
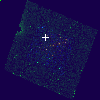
Color images and BPZ results
Catalog: 100.cat
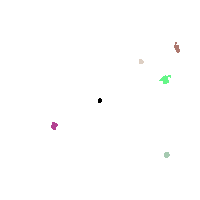
Black segments are analyzed here. Roll mouse over color images to view segments.
Best viewed in a wide browser window (1200 pixels or more). Download SED & P(z) plots to view larger versions.
In P(z) plots: Yellow lines mark the cluster redshift z = 0.570,
Object #100 x,y = (3982, 5561) RA, Dec = (11:58:02.400, -10:45:21.60) = (179.51000, -10.75600) BPZ = 0.939 [0.248--4.428] type = 8.60 (SB2_B10 - SB1_B10) chisq2 = 0.28 ODDS = 0.08 z_cluster = 0.570