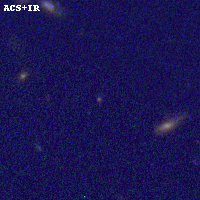
PLCKG282+49 ACS+IR detection object #12180
Color images and BPZ results
Catalog: 12180.cat
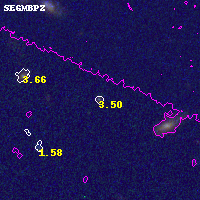
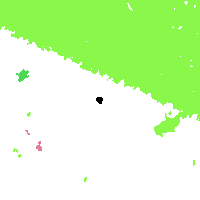
Black segments are analyzed here. Roll mouse over color images to view segments.
Best viewed in a wide browser window (1200 pixels or more). Download SED & P(z) plots to view larger versions.
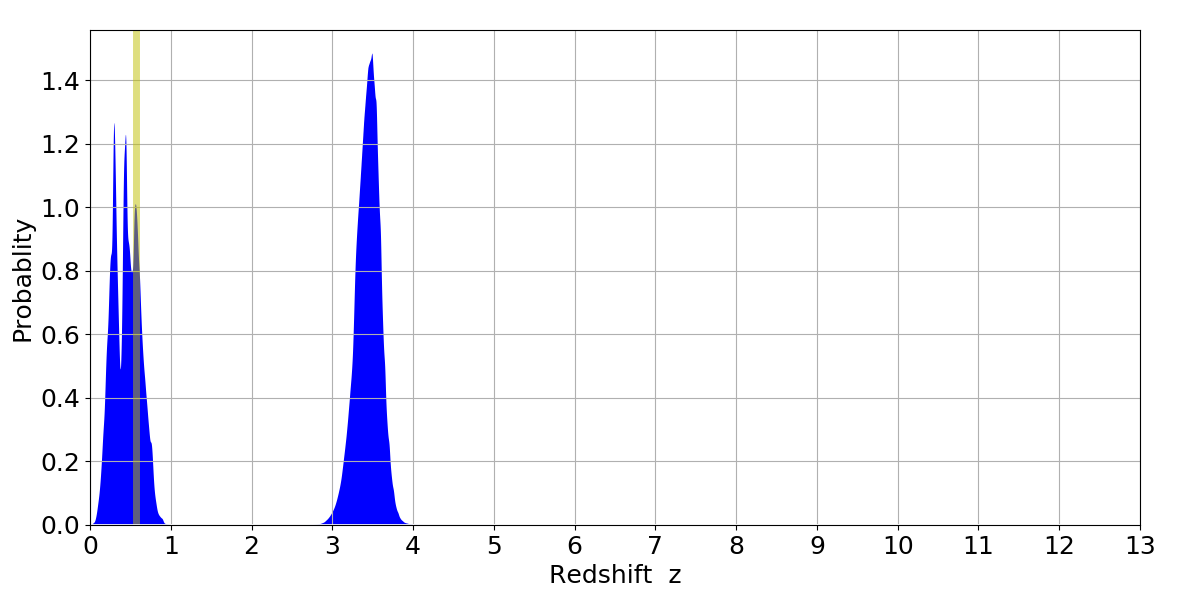
In P(z) plots: Yellow lines mark the cluster redshift z = 0.570,
Object #12180 x,y = (4992, 3943) RA, Dec = (11:57:58.272, -10:46:58.80) = (179.49280, -10.78300) BPZ = 3.495 [0.200--3.673] type = 9.90 (SB3_B10 - SB2_B10) chisq2 = 0.45 ODDS = 0.41 z_cluster = 0.570