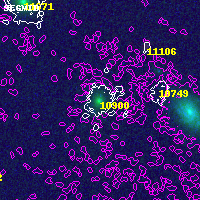
PLCKG282+49 ACS+IR detection object #10900
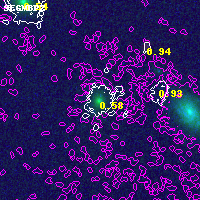
Color images and BPZ results
Catalog: 10900.cat
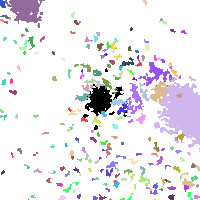
Black segments are analyzed here. Roll mouse over color images to view segments.
Best viewed in a wide browser window (1200 pixels or more). Download SED & P(z) plots to view larger versions.
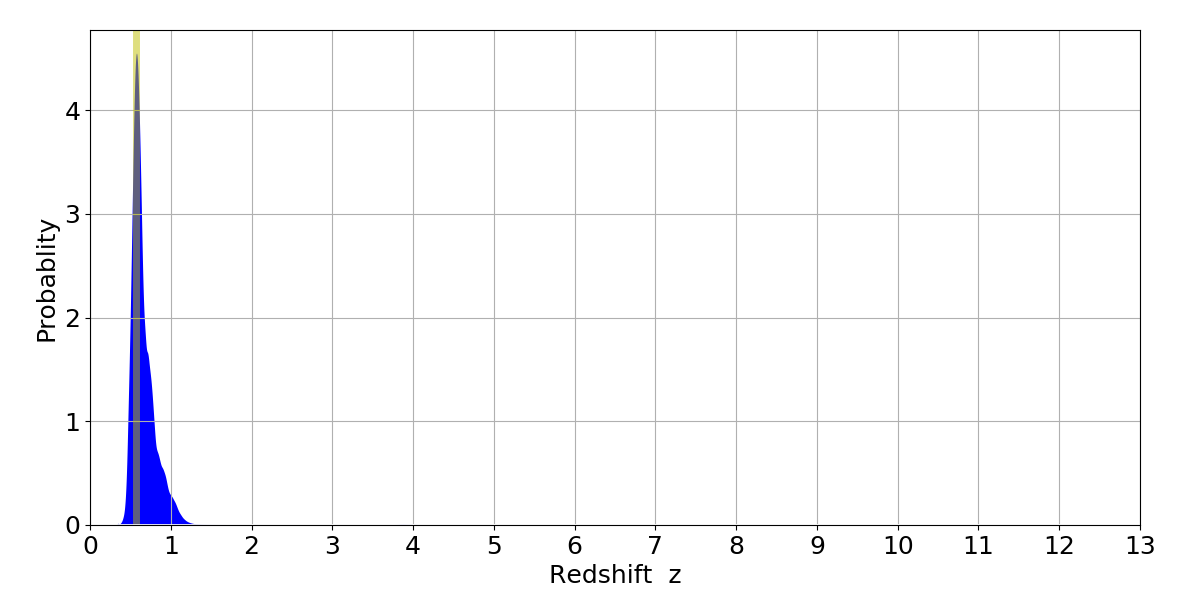
In P(z) plots: Yellow lines mark the cluster redshift z = 0.570,
Object #10900 x,y = (4534, 3725) RA, Dec = (11:58:00.144, -10:47:11.76) = (179.50060, -10.78660) BPZ = 0.581 [0.476--1.030] type = 3.00 (Ell5_A_0) chisq2 = 0.00 ODDS = 0.50 z_cluster = 0.570