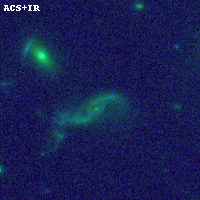
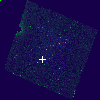
PLCKG282+49 ACS+IR detection object #10003
Color images and BPZ results
Catalog: 10003.cat
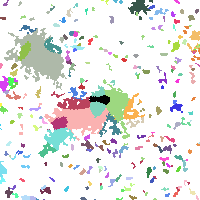
Black segments are analyzed here. Roll mouse over color images to view segments.
Best viewed in a wide browser window (1200 pixels or more). Download SED & P(z) plots to view larger versions.
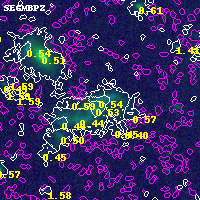
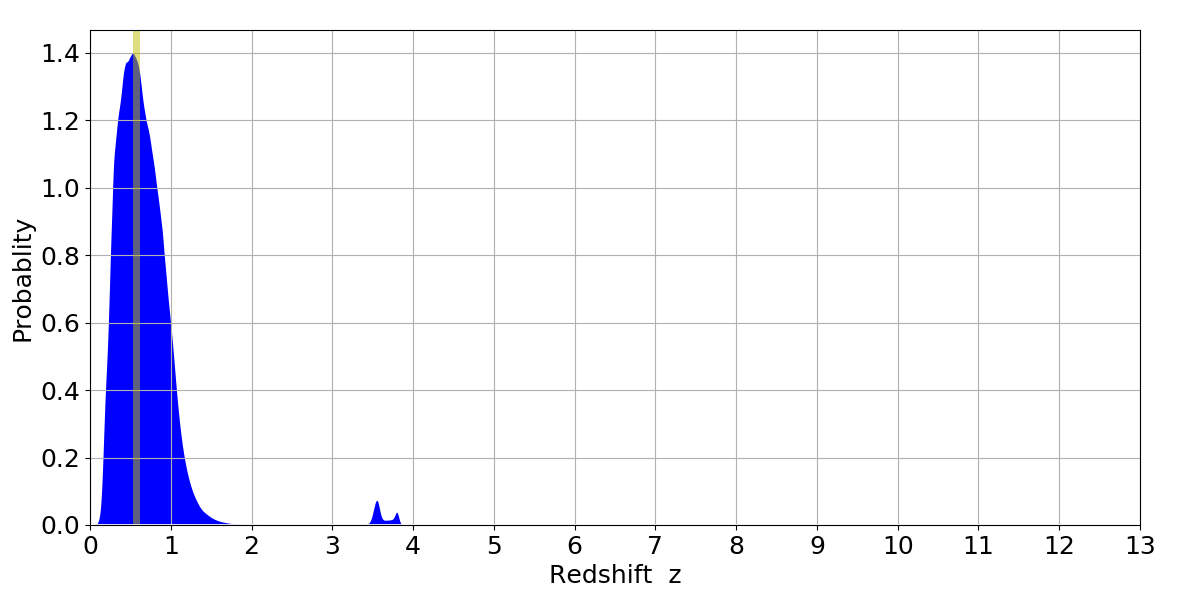
In P(z) plots: Yellow lines mark the cluster redshift z = 0.570,
Object #10003 x,y = (3695, 3635) RA, Dec = (11:58:03.552, -10:47:17.16) = (179.51480, -10.78810) BPZ = 0.536 [0.221--1.278] type = 6.10 (Sbc_B10 - Scd_B10) chisq2 = 0.00 ODDS = 0.17 z_cluster = 0.570