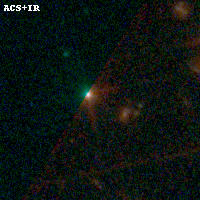
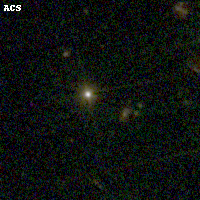
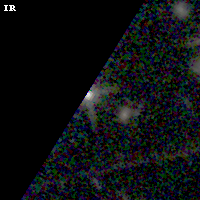
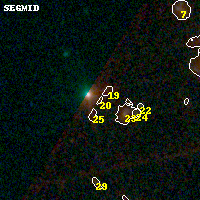
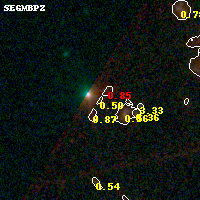
PLCKG138-10 IR detection object #20
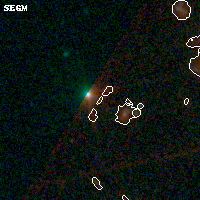
Color images and BPZ results
Catalog: 20.cat
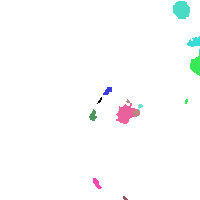
Black segments are analyzed here. Roll mouse over color images to view segments.
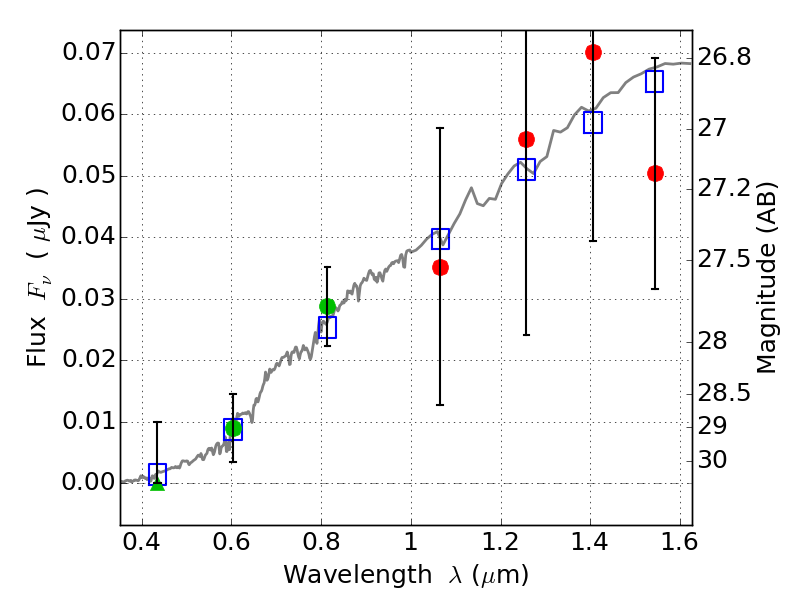
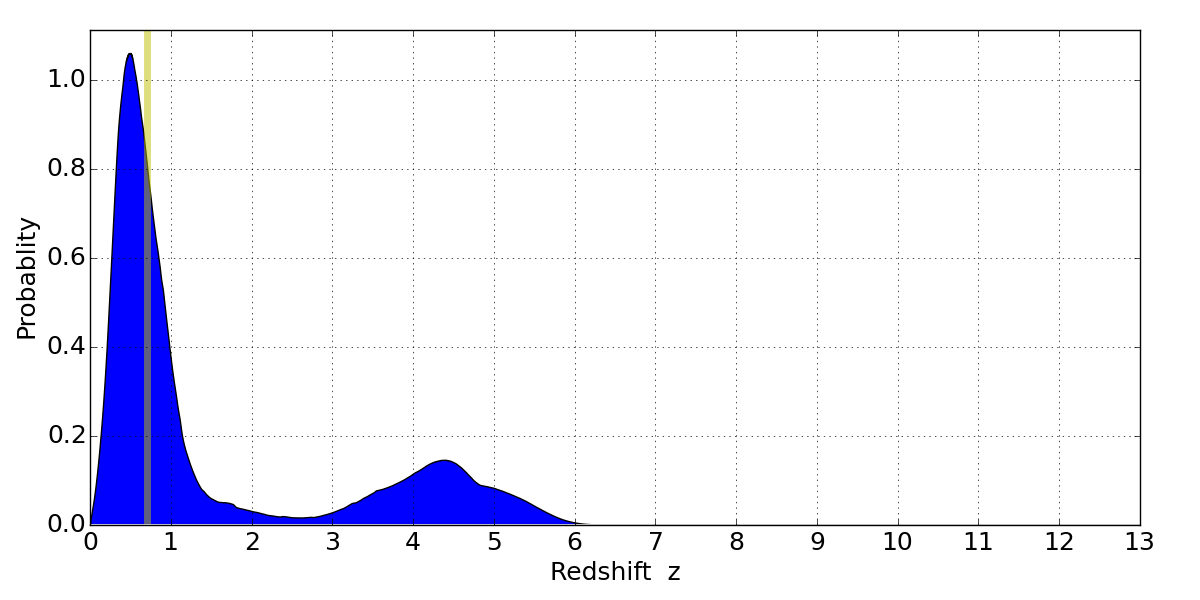
Best viewed in a wide browser window (1200 pixels or more). Download SED & P(z) plots to view larger versions.
In P(z) plots: Yellow lines mark the cluster redshift z = 0.702,
Object #20 x,y = (1826, 3894) RA, Dec = (02:27:10.320, 49:01:53.04) = (36.79300, 49.03140) BPZ = 0.497 [0.188--5.246] type = 3.00 (Ell5_A_0) chisq2 = 0.25 ODDS = 0.13 z_cluster = 0.702