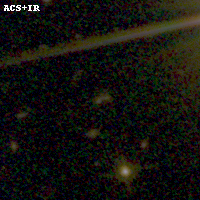
PLCKG138-10-PAR IR detection object #502
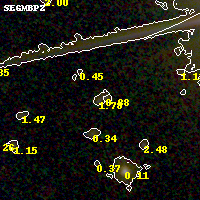
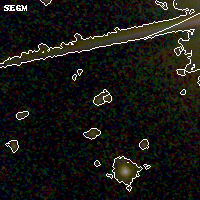
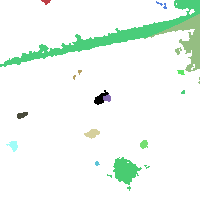
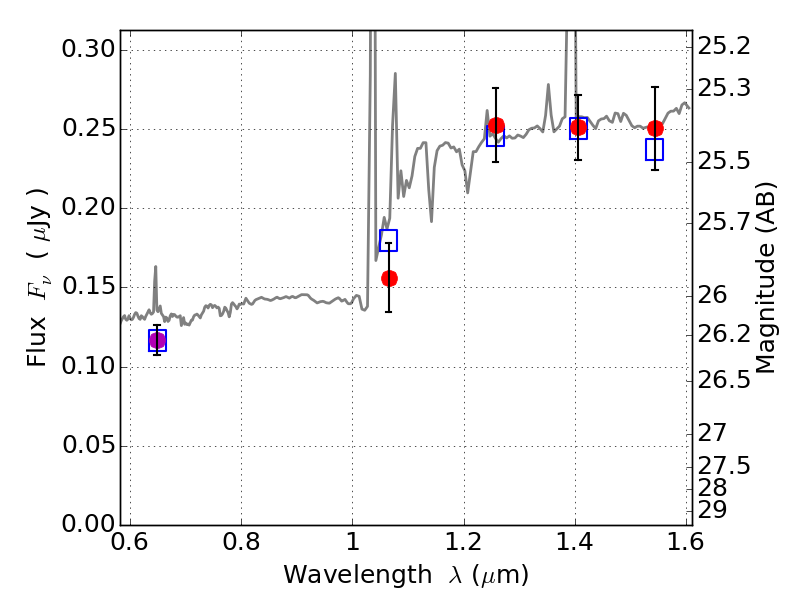
Color images and BPZ results
Catalog: 502.cat
Black segments are analyzed here. Roll mouse over color images to view segments.
Best viewed in a wide browser window (1200 pixels or more). Download SED & P(z) plots to view larger versions.
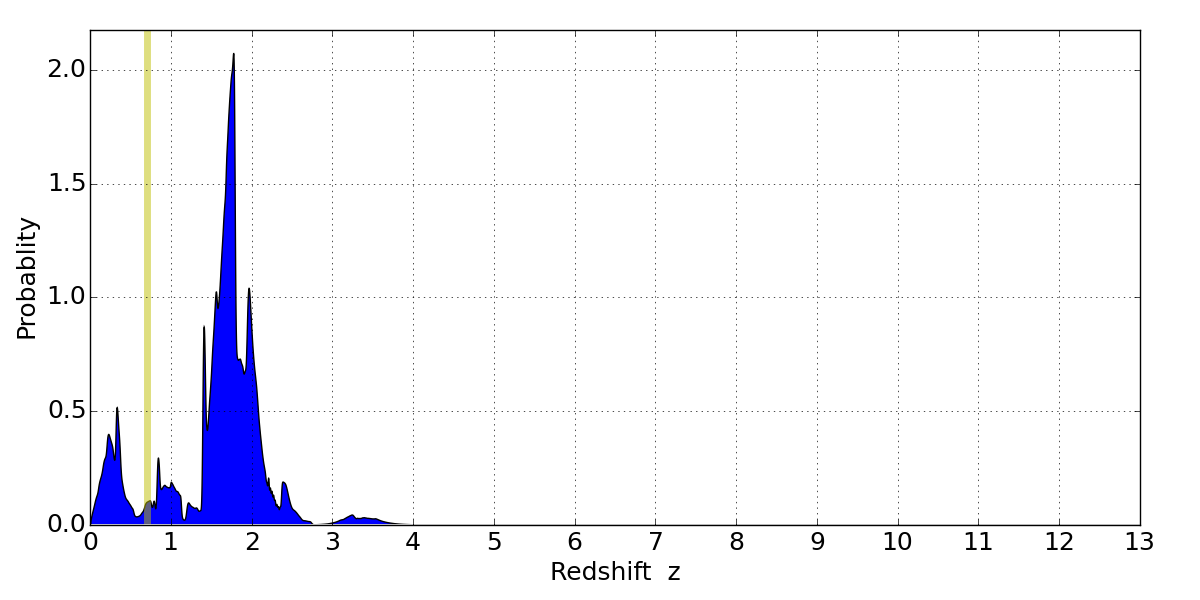
In P(z) plots: Yellow lines mark the cluster redshift z = 0.702,
Object #502 x,y = (2143, 2861) RA, Dec = (02:27:27.840, 48:55:42.24) = (36.86600, 48.92840) BPZ = 1.779 [0.180--2.548] type = 9.50 (SB3_B10 - SB2_B10) chisq2 = 0.48 ODDS = 0.31 z_cluster = 0.702