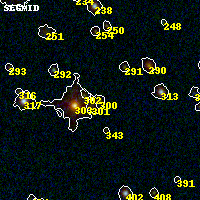
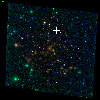
PLCKG004-19 IR detection object #300
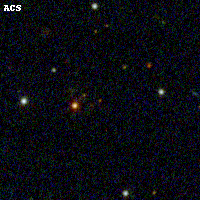
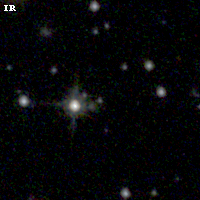
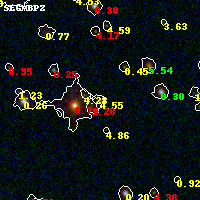
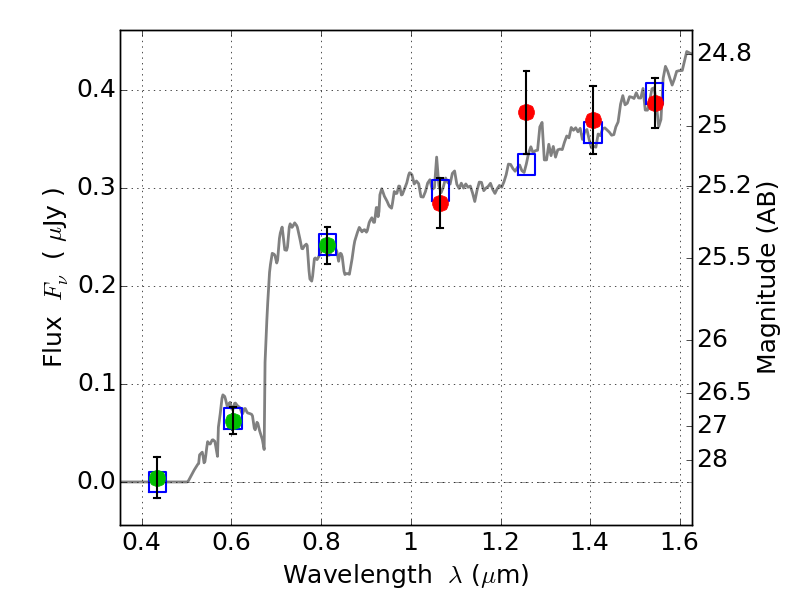
Color images and BPZ results
Catalog: 300.cat
Black segments are analyzed here. Roll mouse over color images to view segments.
Best viewed in a wide browser window (1200 pixels or more). Download SED & P(z) plots to view larger versions.
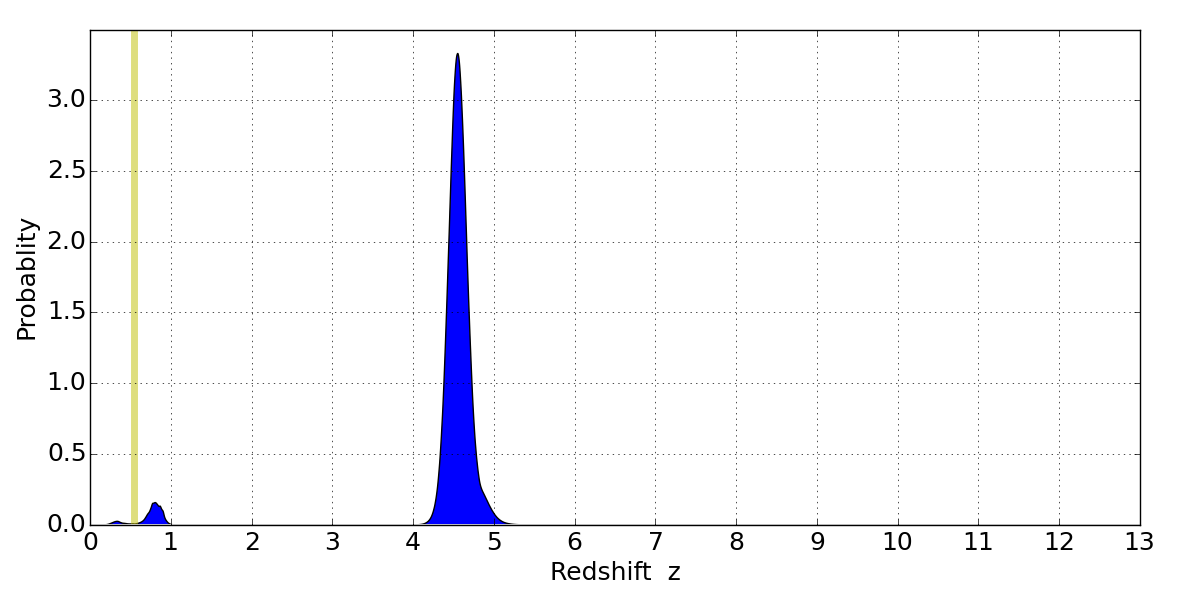
In P(z) plots: Yellow lines mark the cluster redshift z = 0.540,
Object #300 x,y = (2262, 2818) RA, Dec = (19:17:03.624, -33:30:36.72) = (289.26510, -33.51020) BPZ = 4.552 [0.834--4.878] type = 8.00 (SB1_B10) chisq2 = 0.36 ODDS = 0.88 z_cluster = 0.540