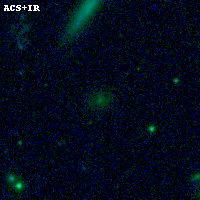
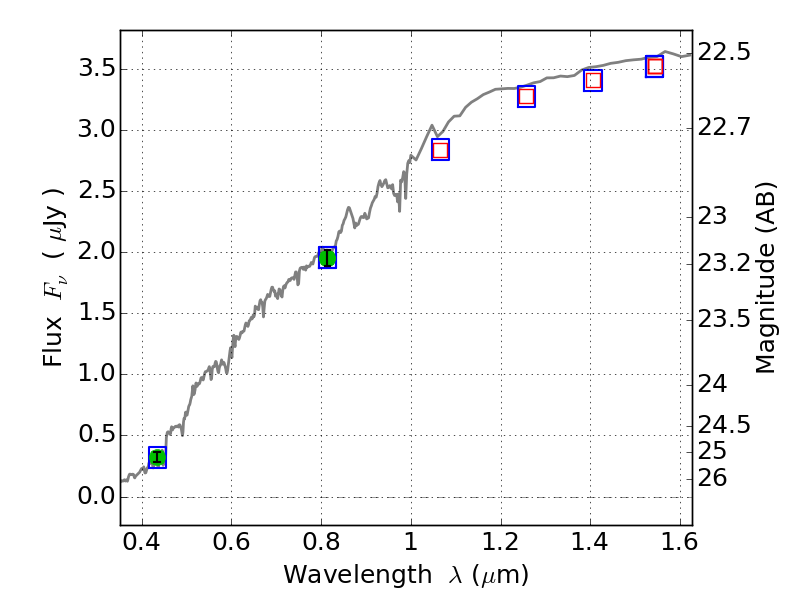
PLCKG004-19 ACS+IR detection object #1033
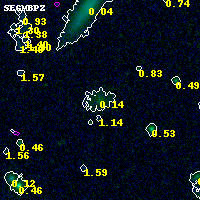
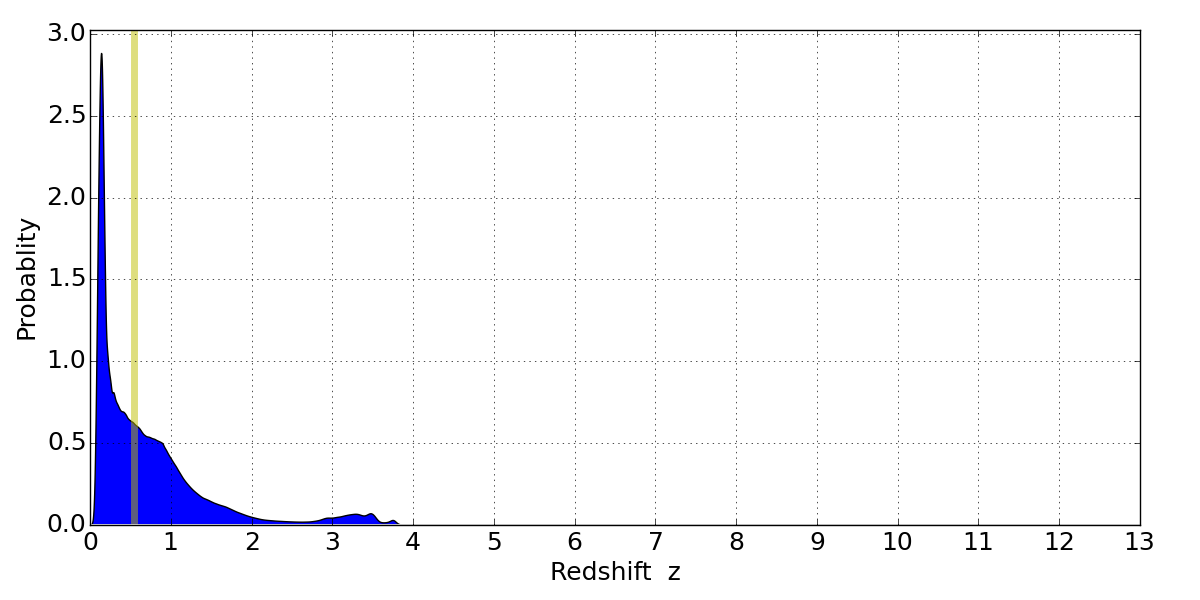
Color images and BPZ results
Catalog: 1033.cat
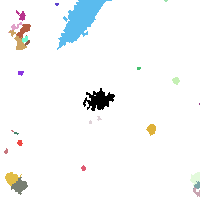
Black segments are analyzed here. Roll mouse over color images to view segments.
Best viewed in a wide browser window (1200 pixels or more). Download SED & P(z) plots to view larger versions.
In P(z) plots: Yellow lines mark the cluster redshift z = 0.540,
Object #1033 x,y = (4116, 3782) RA, Dec = (19:16:57.144, -33:30:08.64) = (289.23810, -33.50240) BPZ = 0.144 [0.091--3.227] type = 3.30 (Ell5_A_0 - Ell4_A_0) chisq2 = 0.00 ODDS = 0.22 z_cluster = 0.540