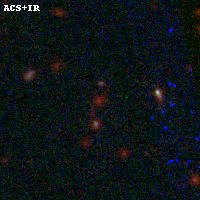
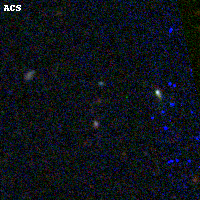
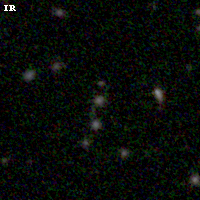
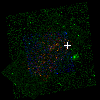
ACT0102-49 IR detection object #643
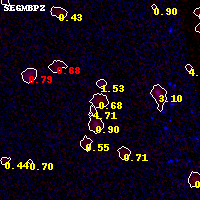
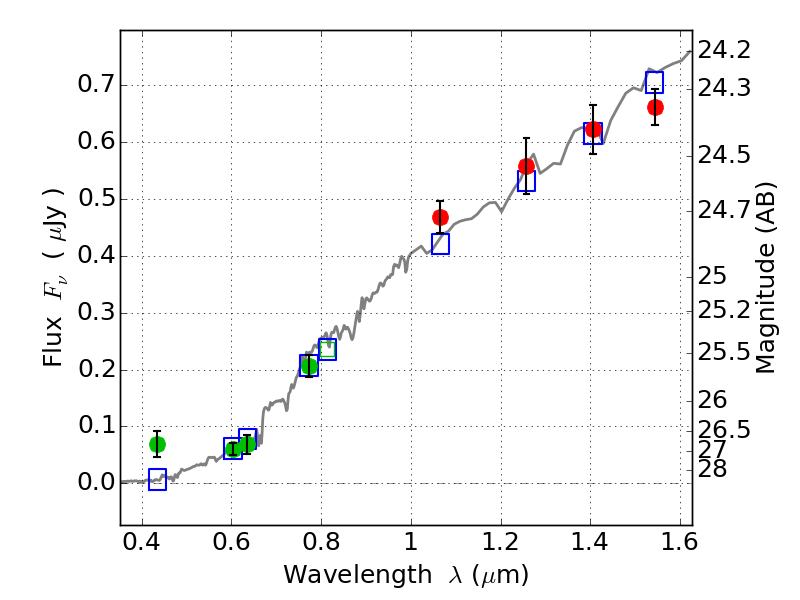
Color images and BPZ results
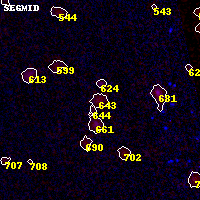
Catalog: 643.cat
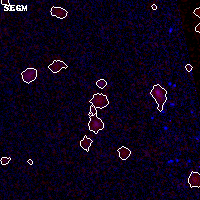
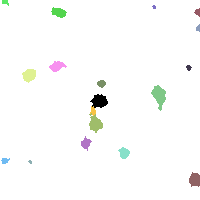
Black segments are analyzed here. Roll mouse over color images to view segments.
Best viewed in a wide browser window (1200 pixels or more). Download SED & P(z) plots to view larger versions.
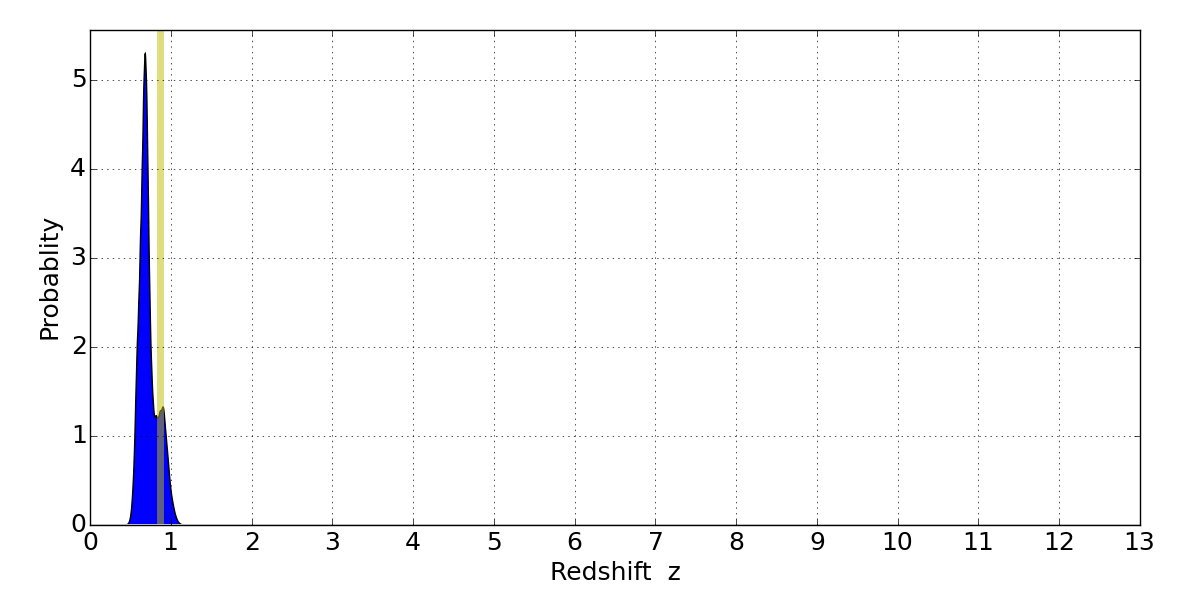
In P(z) plots: Yellow lines mark the cluster redshift z = 0.870,
Object #643 x,y = (5418, 4419) RA, Dec = (01:02:45.912, -49:14:56.40) = (15.69130, -49.24900) BPZ = 0.684 [0.555--0.985] type = 3.60 (Ell4_A_0 - Ell5_A_0) chisq2 = 0.59 ODDS = 0.55 z_cluster = 0.870