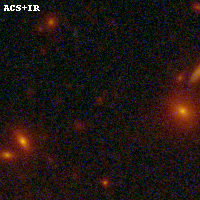
ACT0102-49 IR detection object #501
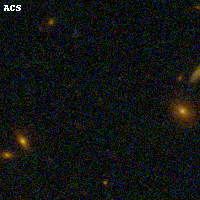
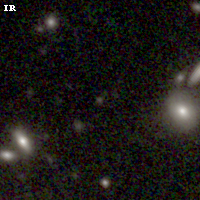
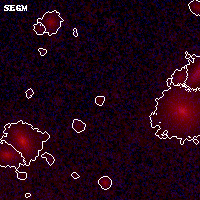
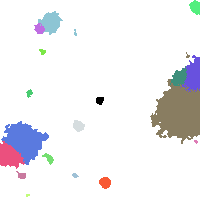
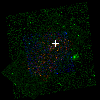
Color images and BPZ results
Catalog: 501.cat
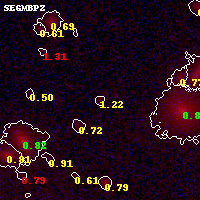
Black segments are analyzed here. Roll mouse over color images to view segments.
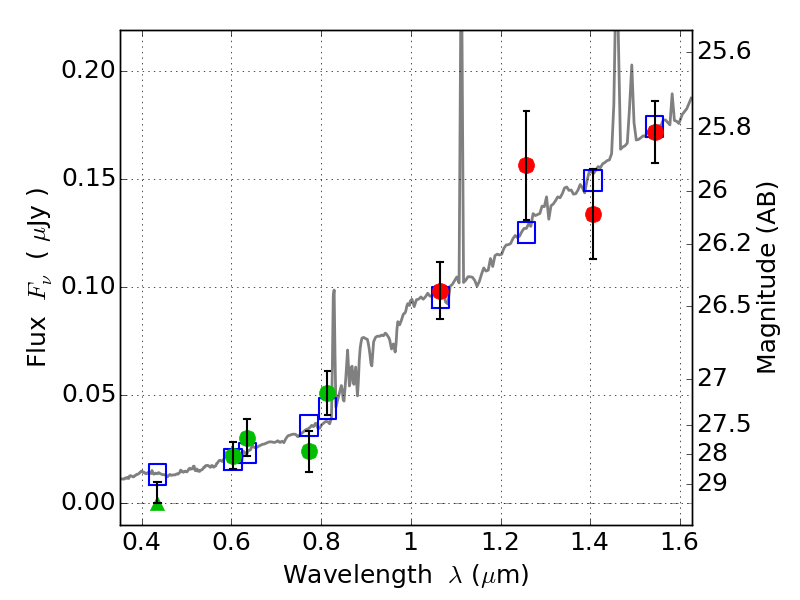
Best viewed in a wide browser window (1200 pixels or more). Download SED & P(z) plots to view larger versions.
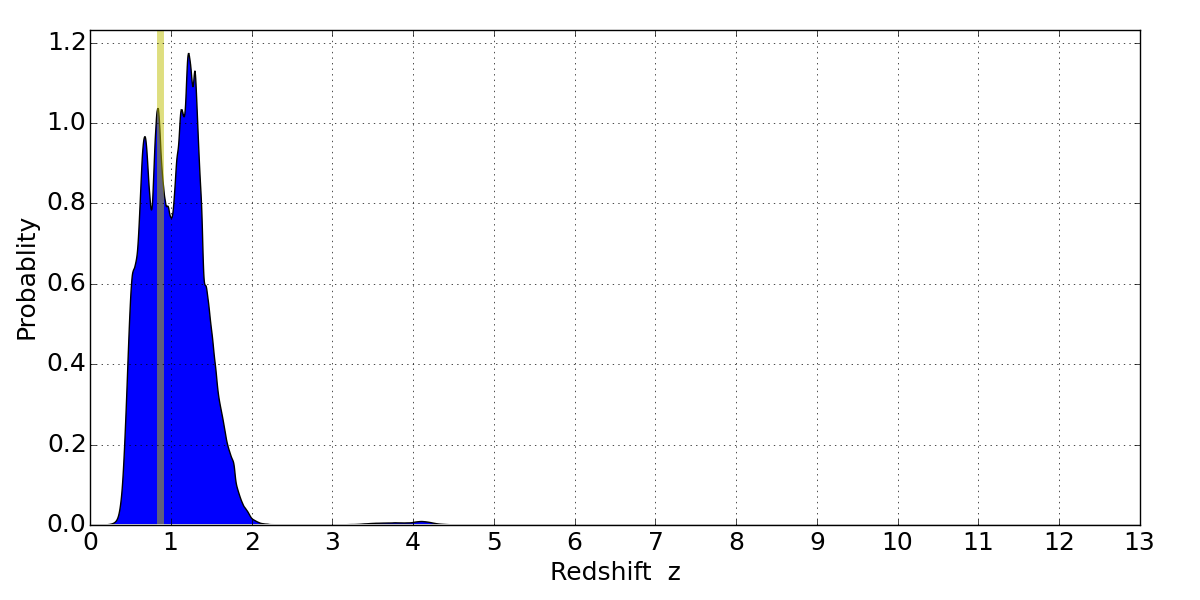
In P(z) plots: Yellow lines mark the cluster redshift z = 0.870,
Object #501 x,y = (4475, 4562) RA, Dec = (01:02:51.696, -49:14:48.12) = (15.71540, -49.24670) BPZ = 1.221 [0.481--1.756] type = 6.80 (Scd_B10 - Sbc_B10) chisq2 = 0.59 ODDS = 0.20 z_cluster = 0.870