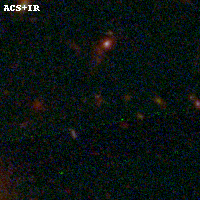
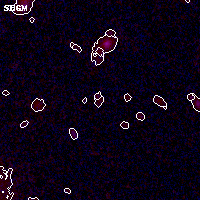
ACT0102-49 IR detection object #190
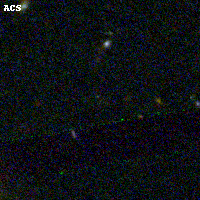
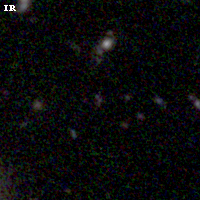
Color images and BPZ results
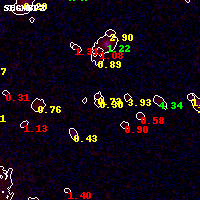
Catalog: 190.cat
Black segments are analyzed here. Roll mouse over color images to view segments.
Best viewed in a wide browser window (1200 pixels or more). Download SED & P(z) plots to view larger versions.
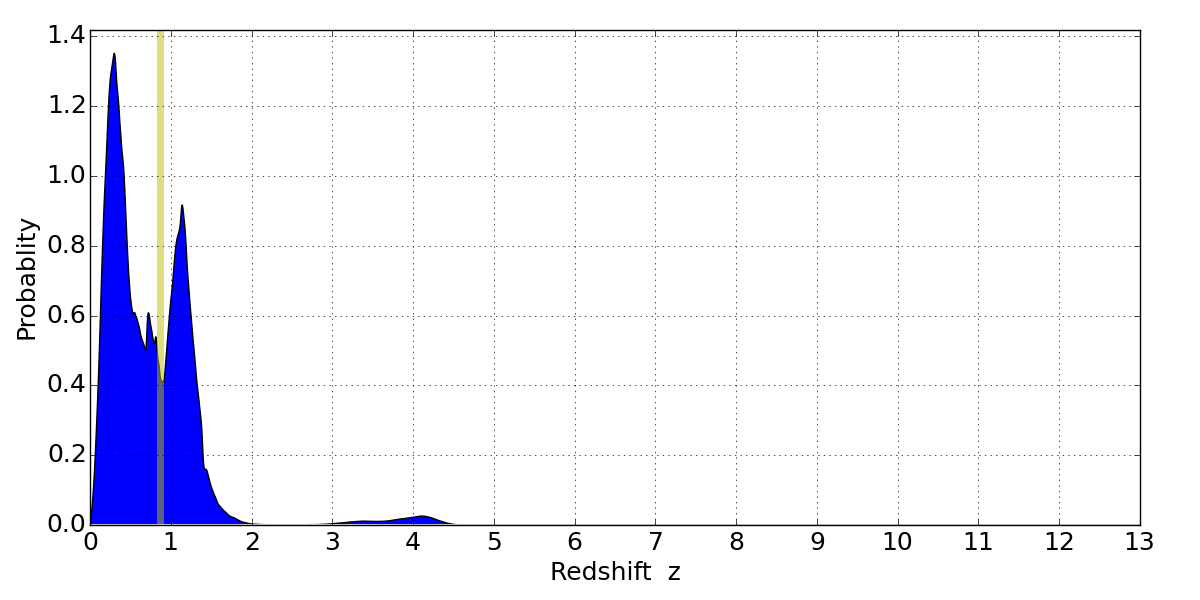
In P(z) plots: Yellow lines mark the cluster redshift z = 0.870,
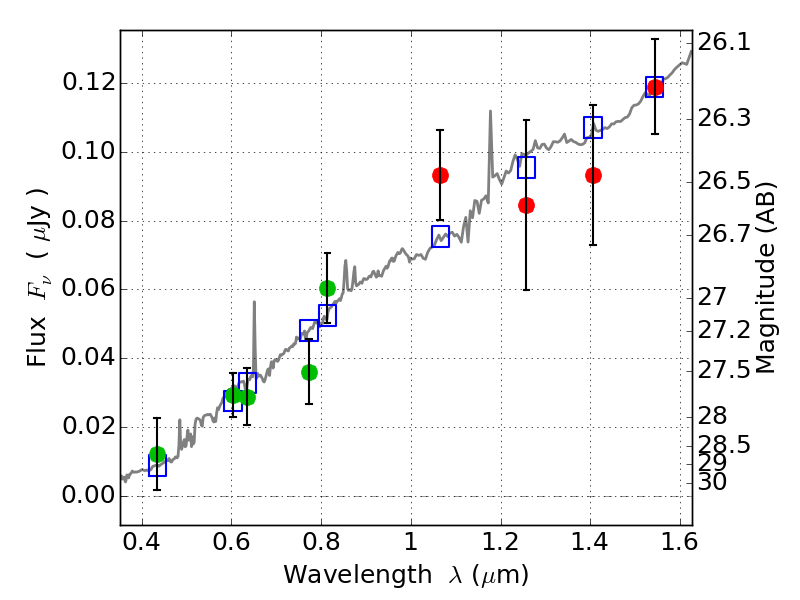
Object #190 x,y = (3281, 2266) RA, Dec = (01:02:59.016, -49:17:05.64) = (15.74590, -49.28490) BPZ = 0.301 [0.120--1.707] type = 6.30 (Sbc_B10 - Scd_B10) chisq2 = 0.58 ODDS = 0.14 z_cluster = 0.870