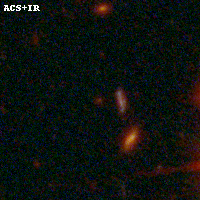
ACT0102-49 IR detection object #1513
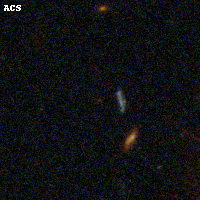
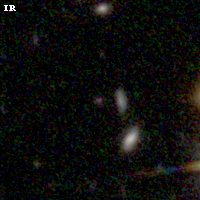
Color images and BPZ results
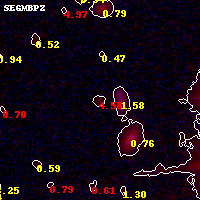
Catalog: 1513.cat
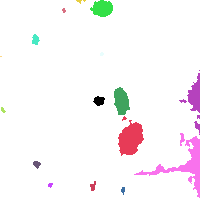
Black segments are analyzed here. Roll mouse over color images to view segments.
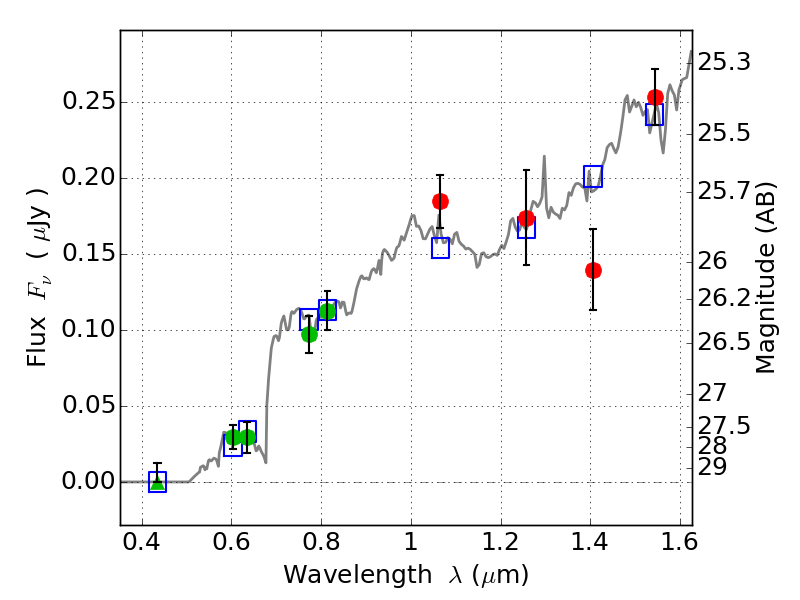
Best viewed in a wide browser window (1200 pixels or more). Download SED & P(z) plots to view larger versions.
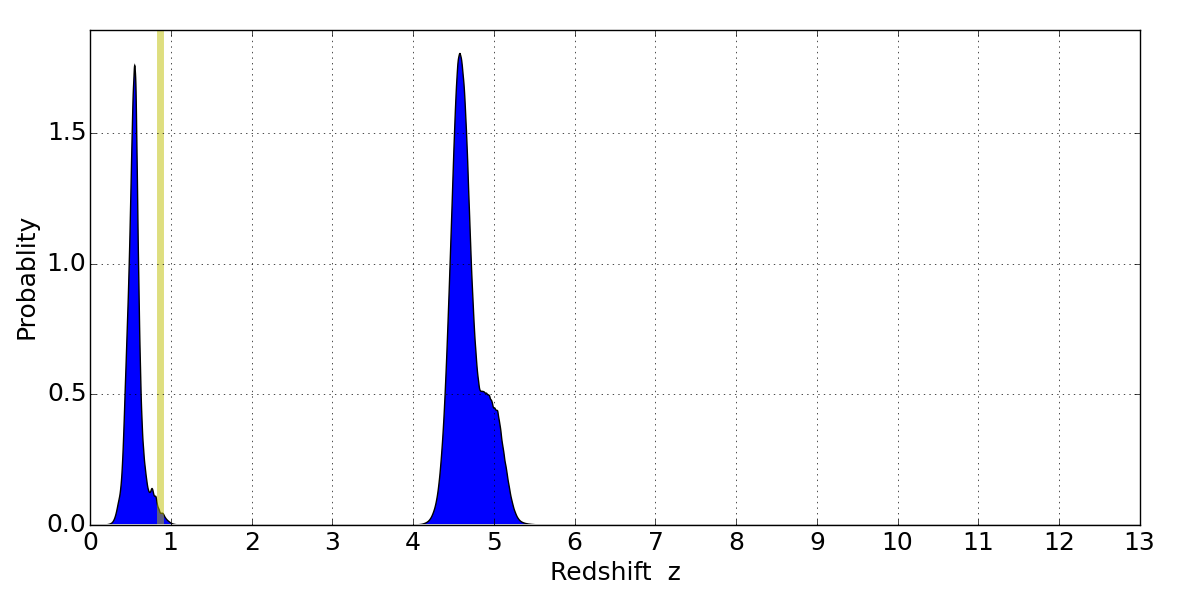
In P(z) plots: Yellow lines mark the cluster redshift z = 0.870,
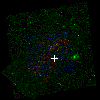
Object #1513 x,y = (4371, 3437) RA, Dec = (01:02:52.320, -49:15:55.44) = (15.71800, -49.26540) BPZ = 4.579 [0.439--5.119] type = 7.10 (Scd_B10 - SB1_B10) chisq2 = 1.03 ODDS = 0.52 z_cluster = 0.870