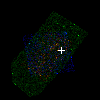
ACT0102-49 IR detection object #809
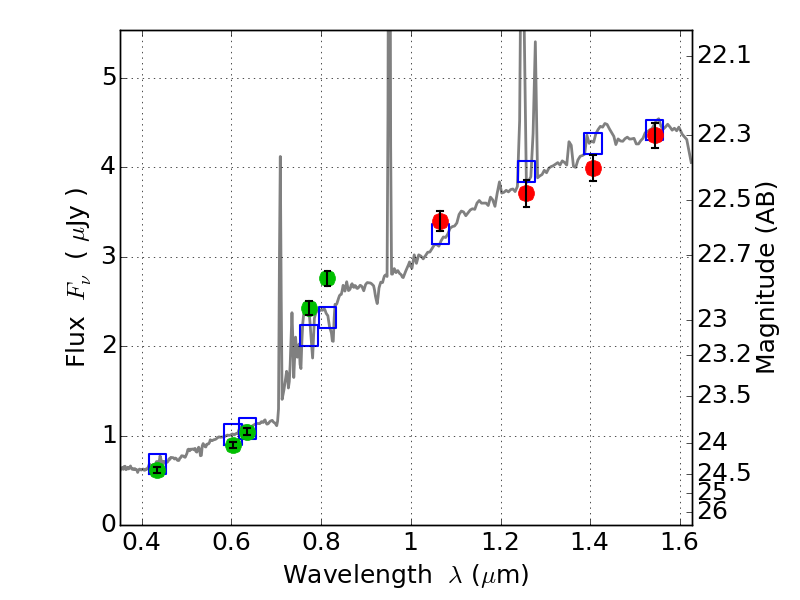
Color images and BPZ results
Catalog: 809.cat
Black segments are analyzed here. Roll mouse over color images to view segments.
Best viewed in a wide browser window (1200 pixels or more). Download SED & P(z) plots to view larger versions.
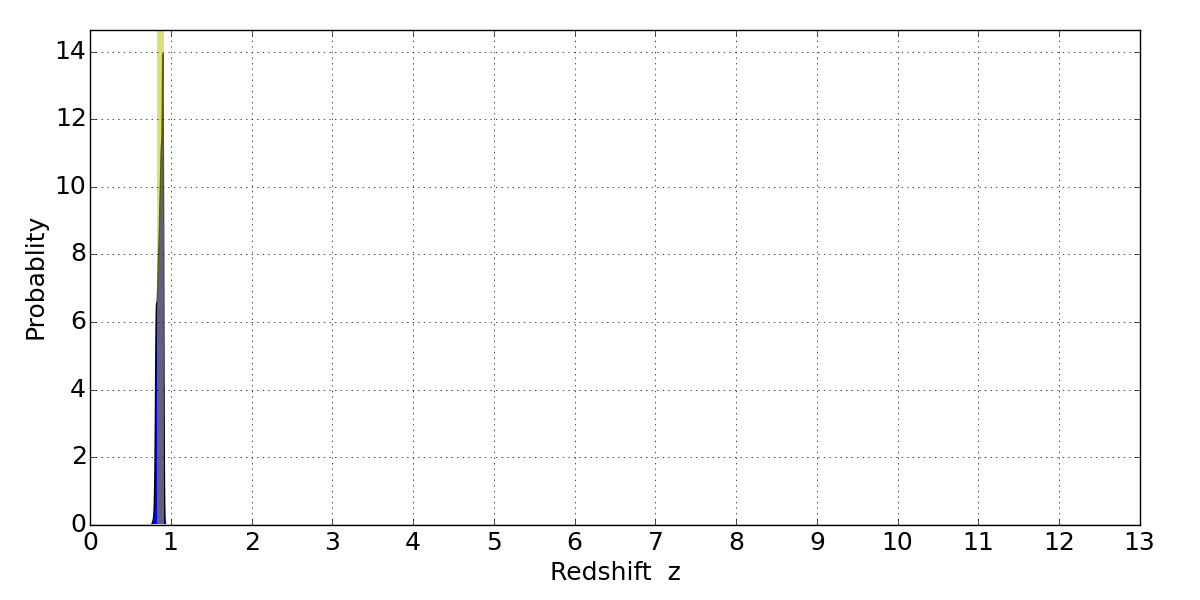
In P(z) plots: Yellow lines mark the cluster redshift z = 0.870,
Object #809 x,y = (4926, 4041) RA, Dec = (01:02:48.936, -49:15:19.08) = (15.70390, -49.25530) BPZ = 0.901 [0.808--0.915] type = 7.80 (SB1_B10 - Scd_B10) chisq2 = 0.79 ODDS = 0.89 z_cluster = 0.870