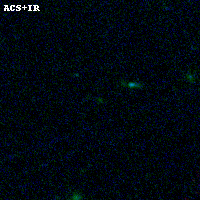
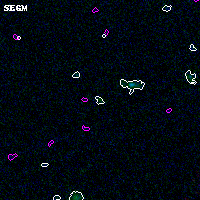
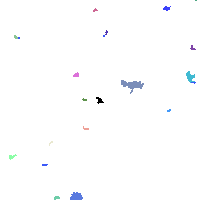
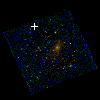
ABELL697 ACS+IR detection object #511
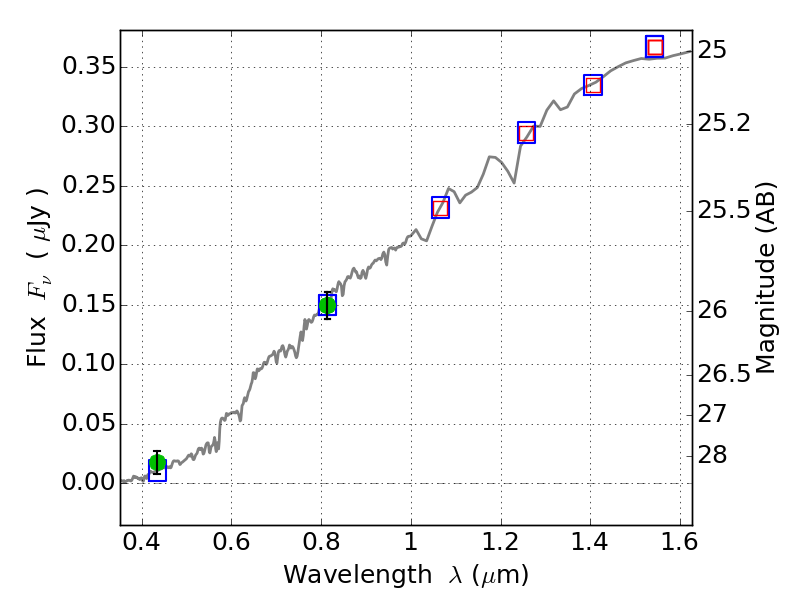
Color images and BPZ results
Catalog: 511.cat
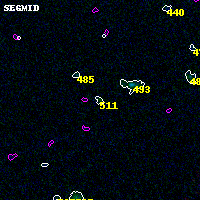
Black segments are analyzed here. Roll mouse over color images to view segments.
Best viewed in a wide browser window (1200 pixels or more). Download SED & P(z) plots to view larger versions.
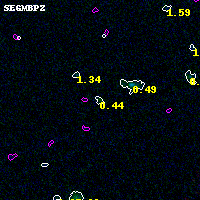
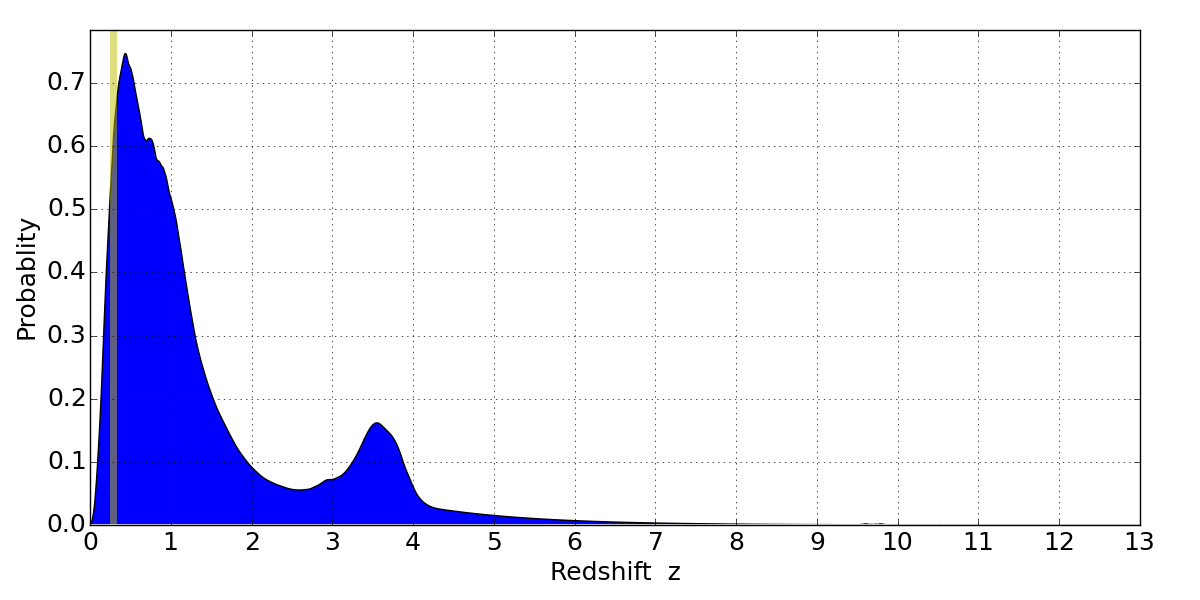
In P(z) plots: Yellow lines mark the cluster redshift z = 0.282,
Object #511 x,y = (1719, 3735) RA, Dec = (08:43:03.120, 36:23:05.64) = (130.76300, 36.38490) BPZ = 0.438 [0.191--4.661] type = 3.00 (Ell5_A_0) chisq2 = 0.07 ODDS = 0.09 z_cluster = 0.282