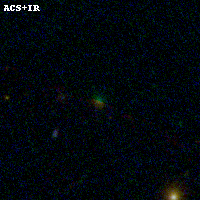
ABELL697 ACS+IR detection object #506
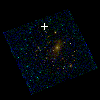
Color images and BPZ results
Catalog: 506.cat
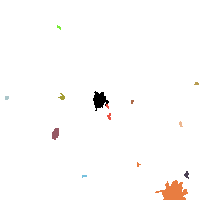
Black segments are analyzed here. Roll mouse over color images to view segments.
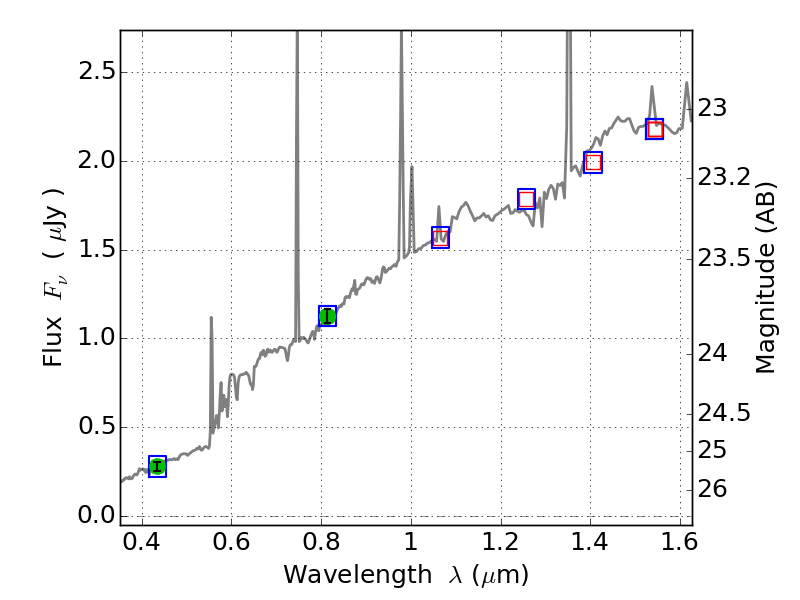
Best viewed in a wide browser window (1200 pixels or more). Download SED & P(z) plots to view larger versions.
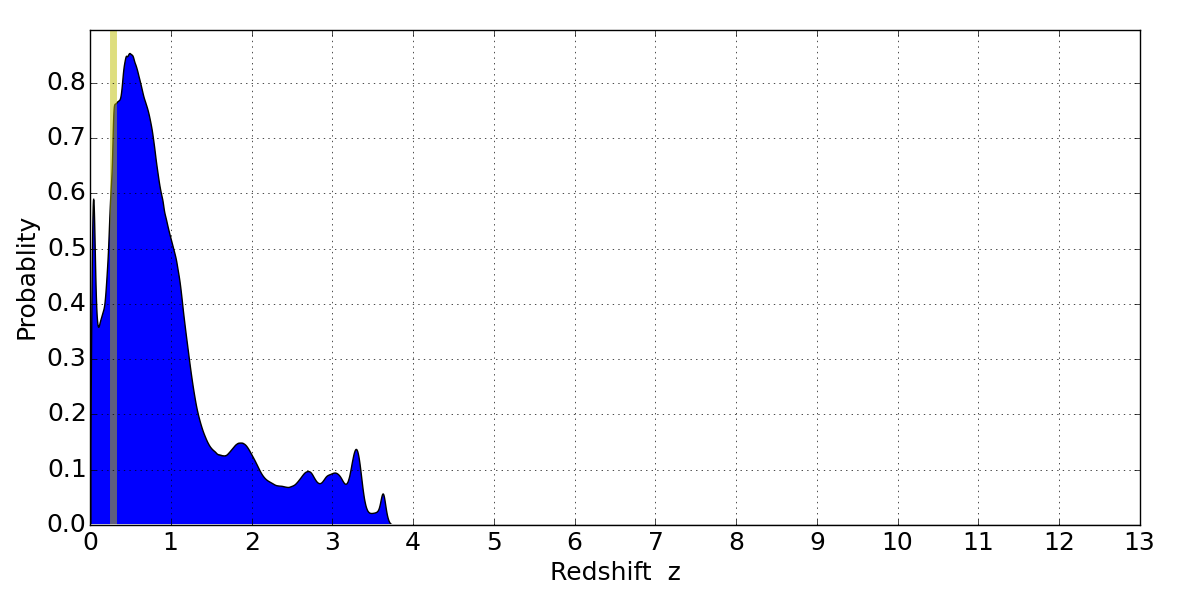
In P(z) plots: Yellow lines mark the cluster redshift z = 0.282,
Object #506 x,y = (2218, 3733) RA, Dec = (08:43:00.624, 36:23:05.64) = (130.75260, 36.38490) BPZ = 0.495 [0.062--3.254] type = 7.30 (Scd_B10 - SB1_B10) chisq2 = 0.00 ODDS = 0.10 z_cluster = 0.282