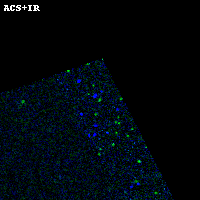
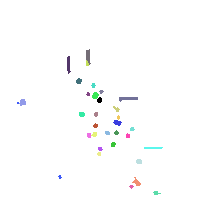
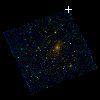
ABELL697 ACS+IR detection object #11
Color images and BPZ results
Catalog: 11.cat
Black segments are analyzed here. Roll mouse over color images to view segments.
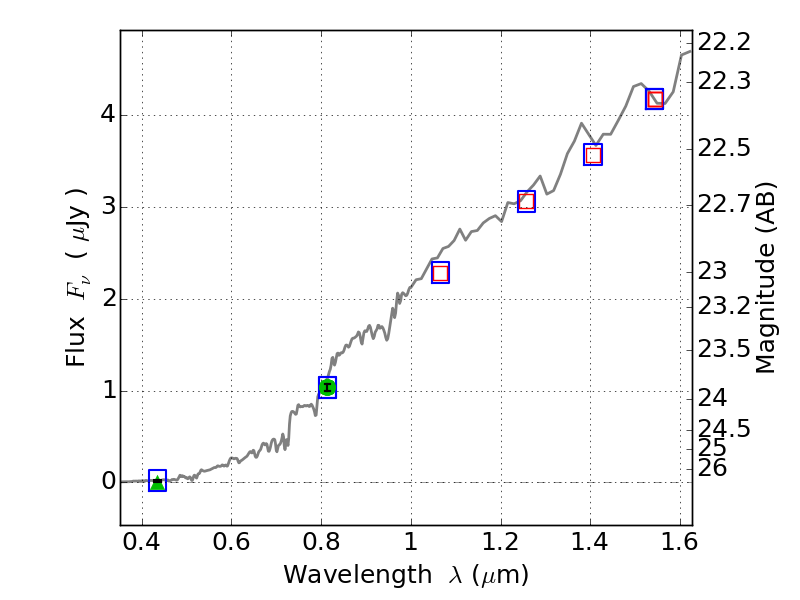
Best viewed in a wide browser window (1200 pixels or more). Download SED & P(z) plots to view larger versions.
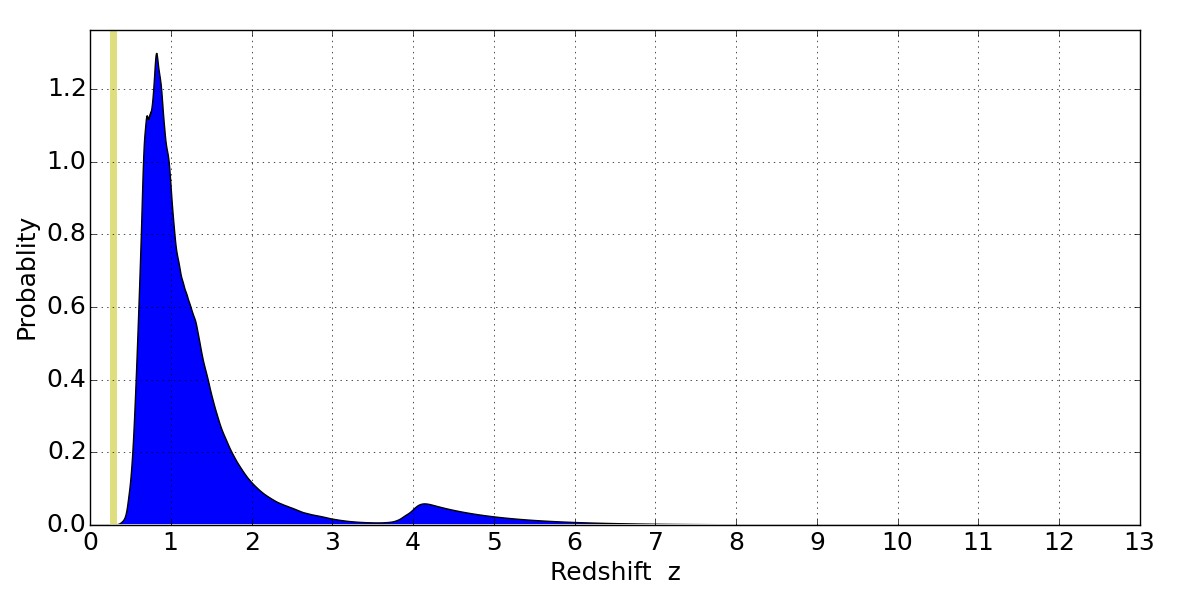
In P(z) plots: Yellow lines mark the cluster redshift z = 0.282,
Object #11 x,y = (3421, 4556) RA, Dec = (08:42:54.648, 36:23:54.96) = (130.72770, 36.39860) BPZ = 0.826 [0.580--4.768] type = 2.00 (Ell6_A_0) chisq2 = 0.00 ODDS = 0.18 z_cluster = 0.282