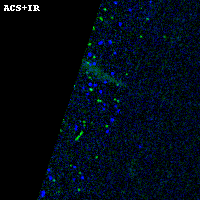
ABELL2537 ACS+IR detection object #403
Color images and BPZ results
Catalog: 403.cat
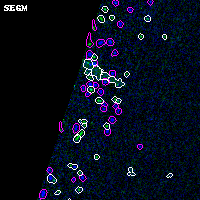
Black segments are analyzed here. Roll mouse over color images to view segments.
Best viewed in a wide browser window (1200 pixels or more). Download SED & P(z) plots to view larger versions.
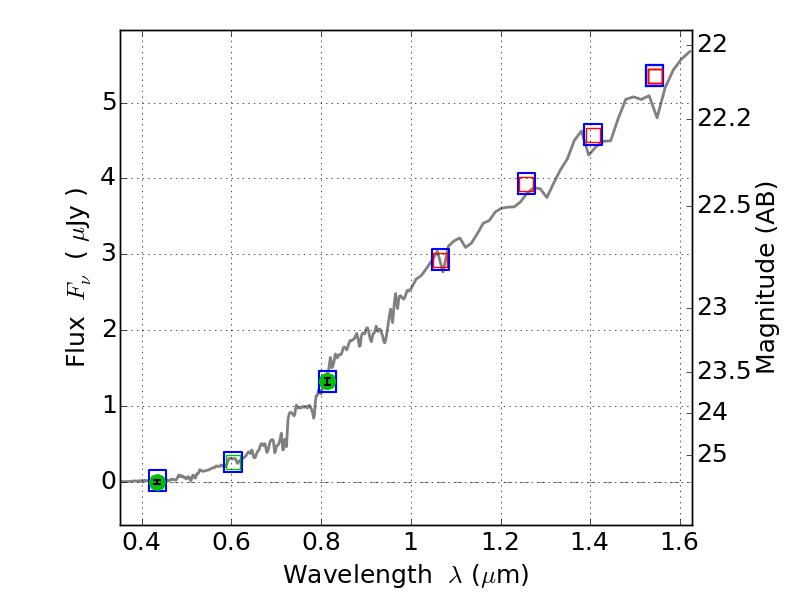
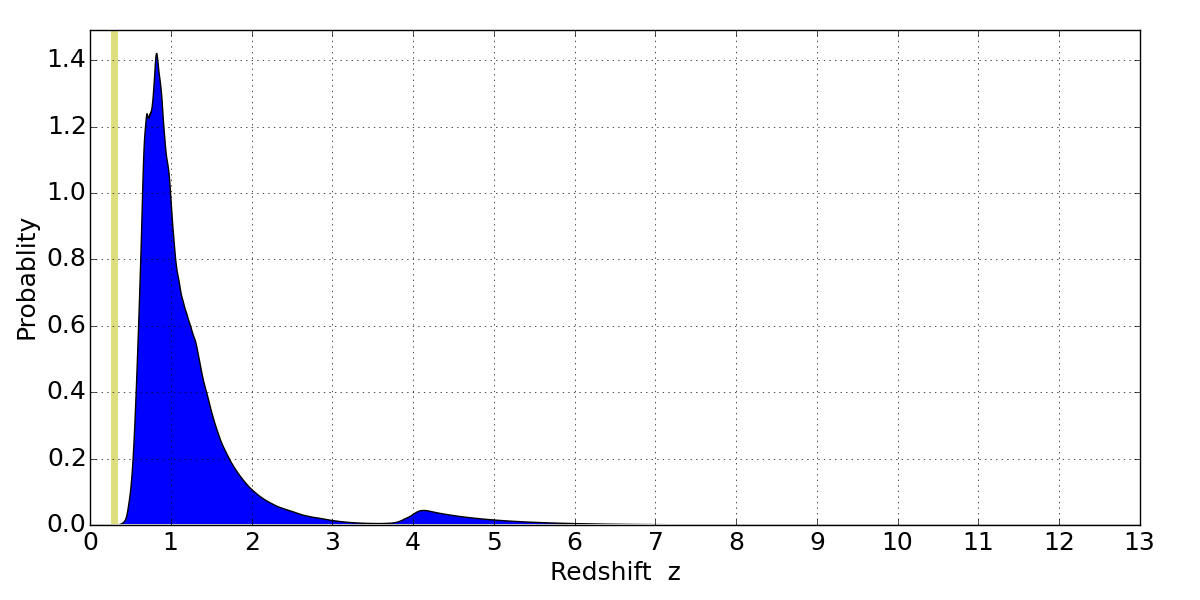
In P(z) plots: Yellow lines mark the cluster redshift z = 0.297,
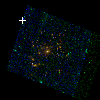
Object #403 x,y = (1133, 4002) RA, Dec = (23:08:27.096, -2:09:58.32) = (347.11290, -2.16620) BPZ = 0.825 [0.583--4.416] type = 2.00 (Ell6_A_0) chisq2 = 0.00 ODDS = 0.19 z_cluster = 0.297