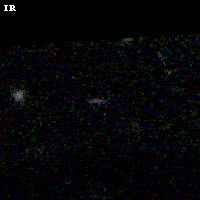
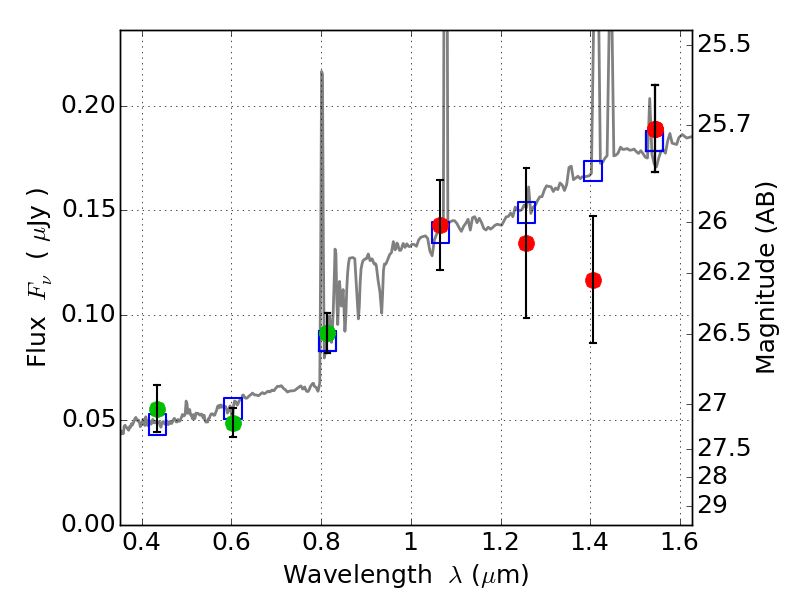
ABELL2537 ACS+IR detection object #1038
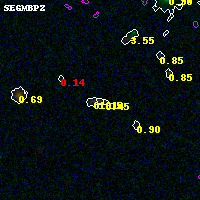
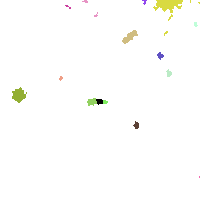
Color images and BPZ results
Catalog: 1038.cat
Black segments are analyzed here. Roll mouse over color images to view segments.
Best viewed in a wide browser window (1200 pixels or more). Download SED & P(z) plots to view larger versions.
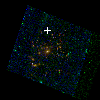
In P(z) plots: Yellow lines mark the cluster redshift z = 0.297,
Object #1038 x,y = (2369, 3529) RA, Dec = (23:08:22.152, -2:10:26.76) = (347.09230, -2.17410) BPZ = 1.148 [0.481--1.389] type = 8.80 (SB2_B10 - SB1_B10) chisq2 = 0.49 ODDS = 0.53 z_cluster = 0.297