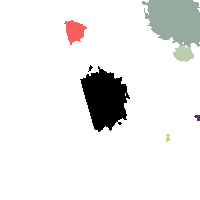
ABELL1758 IR detection object #1
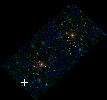
Color images and BPZ results
Catalog: 1.cat
Black segments are analyzed here. Roll mouse over color images to view segments.
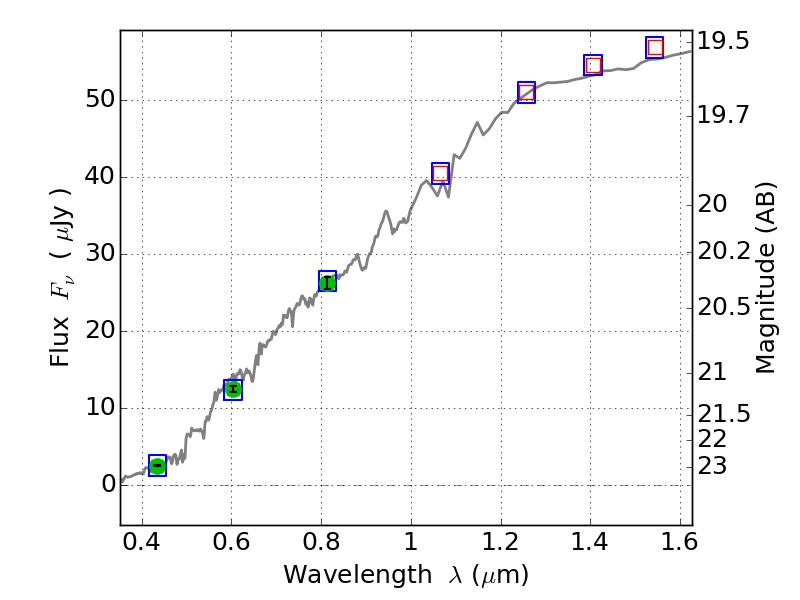
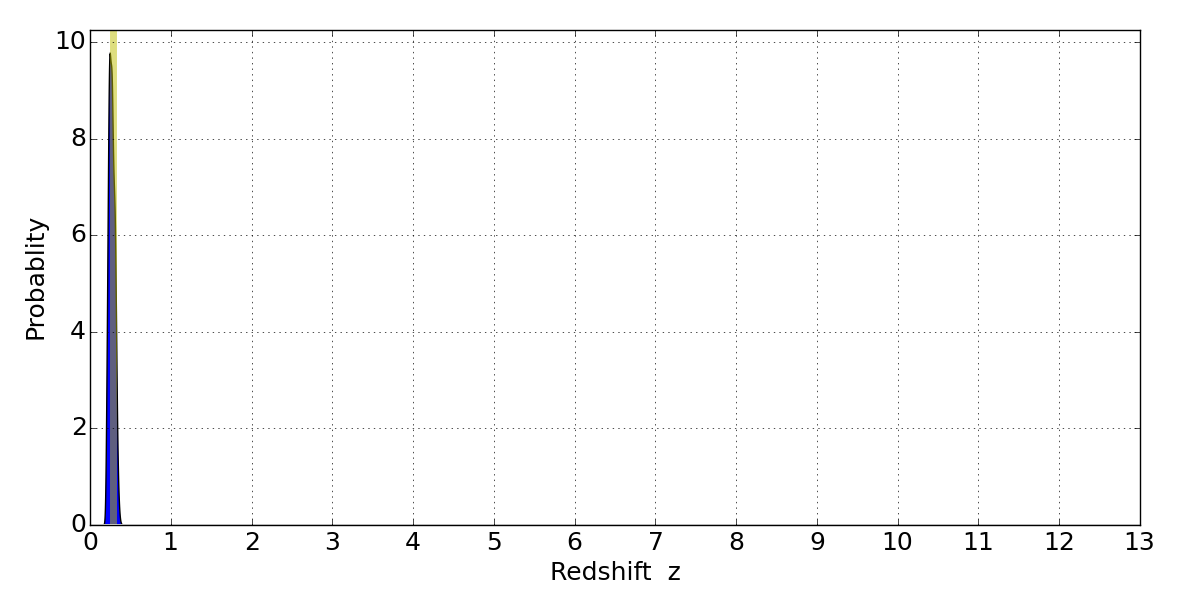
Best viewed in a wide browser window (1200 pixels or more). Download SED & P(z) plots to view larger versions.
In P(z) plots: Yellow lines mark the cluster redshift z = 0.280,
Object #1 x,y = (1728, 1279) RA, Dec = (13:32:59.280, 50:30:19.80) = (203.24700, 50.50550) BPZ = 0.250 [0.207--0.345] type = 1.40 (Ell7_A_0 - Ell6_A_0) chisq2 = 0.01 ODDS = 0.75 z_cluster = 0.280