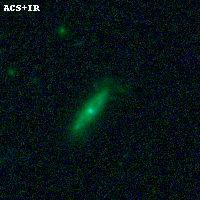
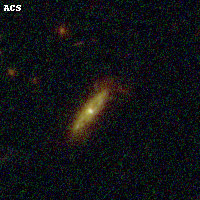
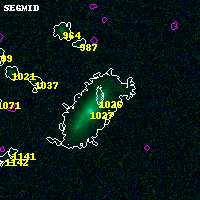
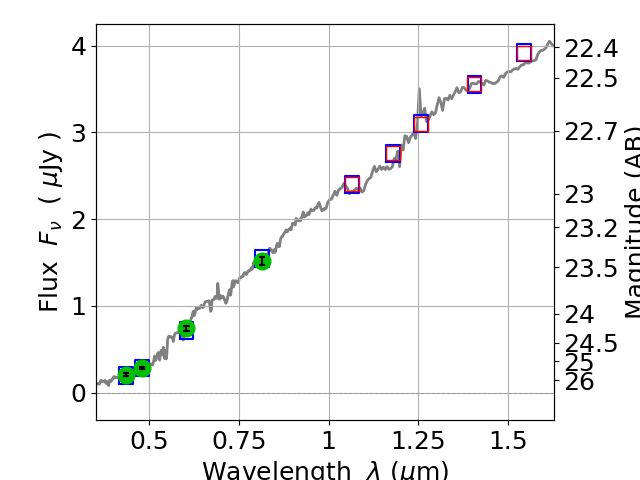
WHL0137-08 ACS+IR detection object #1026
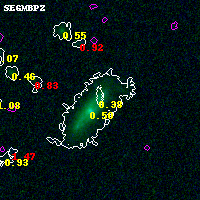
Color images and BPZ results
Catalog: 1026.cat
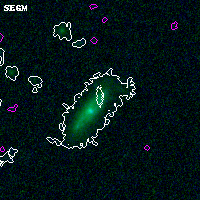
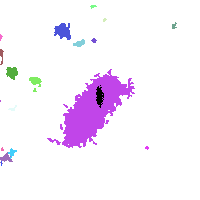
Black segments are analyzed here. Roll mouse over color images to view segments.
Best viewed in a wide browser window (1200 pixels or more). Download SED & P(z) plots to view larger versions.
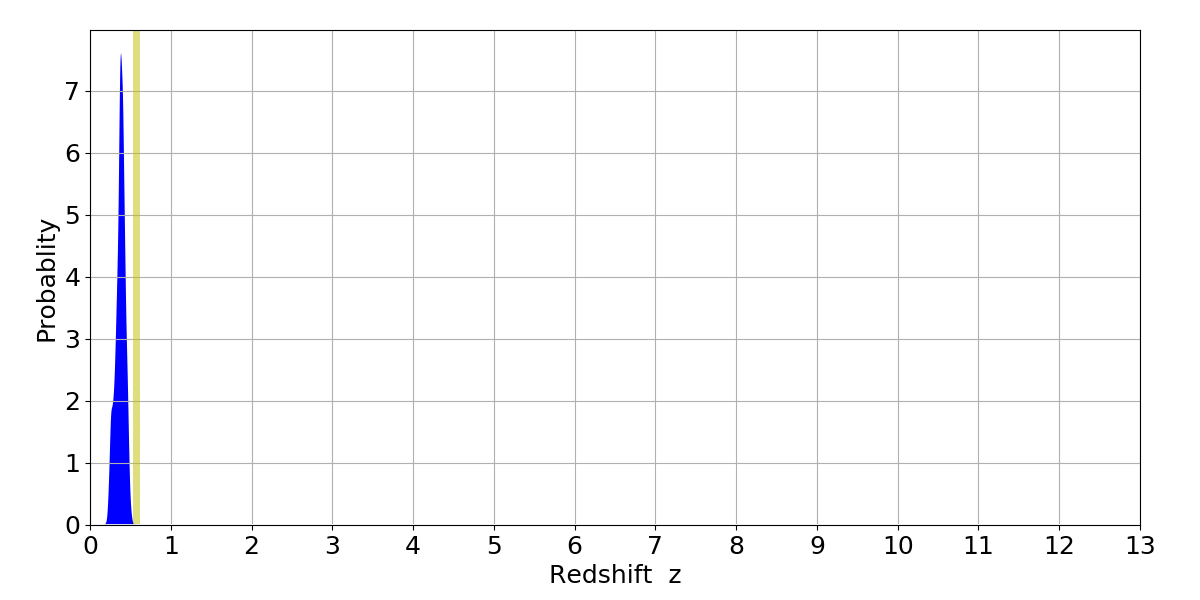
In P(z) plots: Yellow lines mark the cluster redshift z = 0.566,
Object #1026 x,y = (2345, 3871) RA, Dec = (01:37:25.752, -8:25:59.16) = (24.35730, -8.43310) BPZ = 0.384 [0.249--0.482] type = 5.90 (Sbc_B10 - ES0_B10) chisq2 = 0.02 ODDS = 0.66 z_cluster = 0.566