SPT0615-57 ACS+IR detection object #693
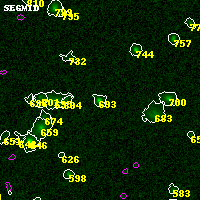
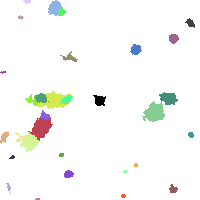
Color images and BPZ results
Catalog: 693.cat
Black segments are analyzed here. Roll mouse over color images to view segments.
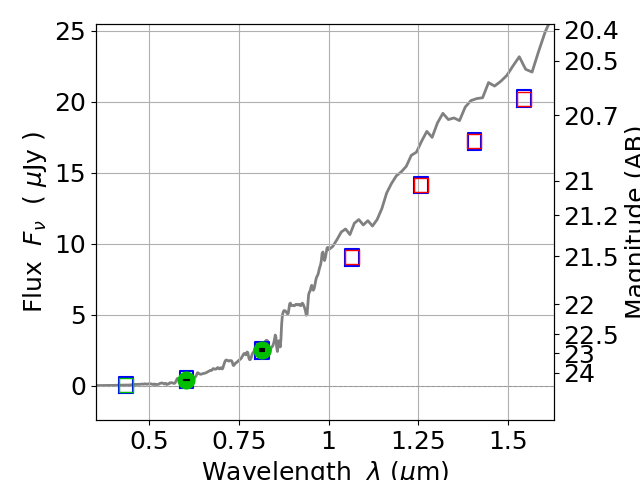
Best viewed in a wide browser window (1200 pixels or more). Download SED & P(z) plots to view larger versions.
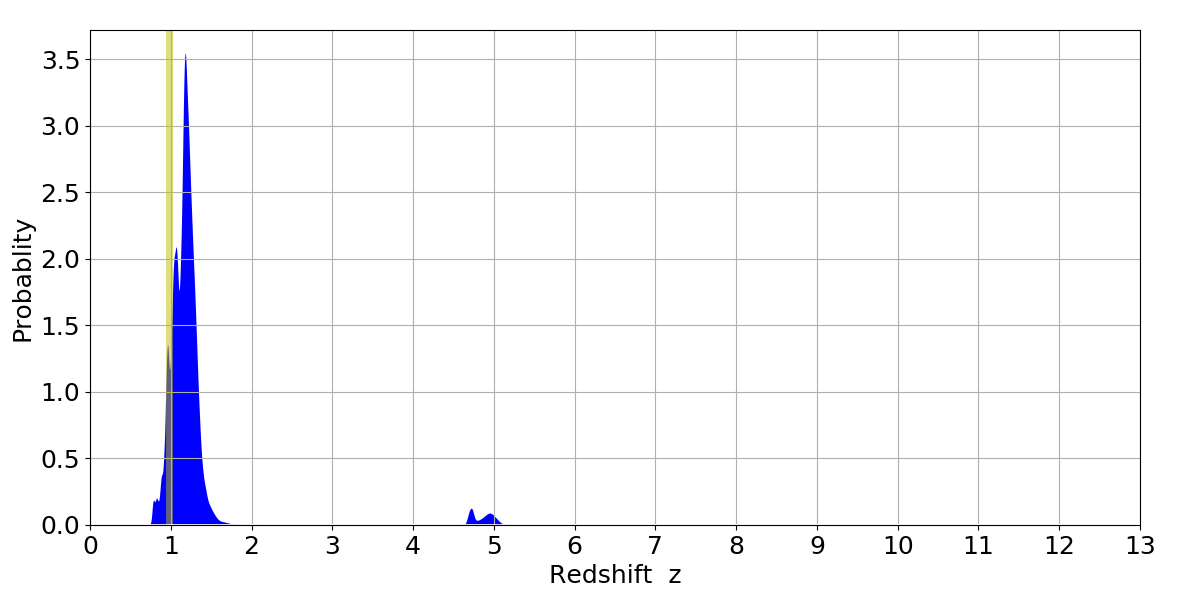
In P(z) plots: Yellow lines mark the cluster redshift z = 0.972,
Object #693 x,y = (3602, 1377) RA, Dec = (06:15:54.960, -57:50:02.40) = (93.97900, -57.83400) BPZ = 1.185 [0.890--4.701] type = 1.70 (Ell6_A_0 - Ell7_A_0) chisq2 = 0.00 ODDS = 0.48 z_cluster = 0.972