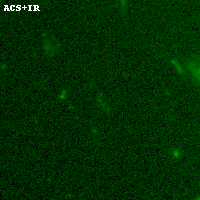
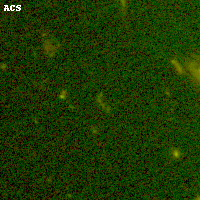
SPT0615-57 ACS+IR detection object #20131
Color images and BPZ results
Catalog: 20131.cat
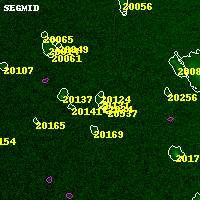
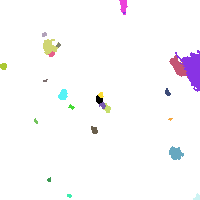
Black segments are analyzed here. Roll mouse over color images to view segments.
Best viewed in a wide browser window (1200 pixels or more). Download SED & P(z) plots to view larger versions.
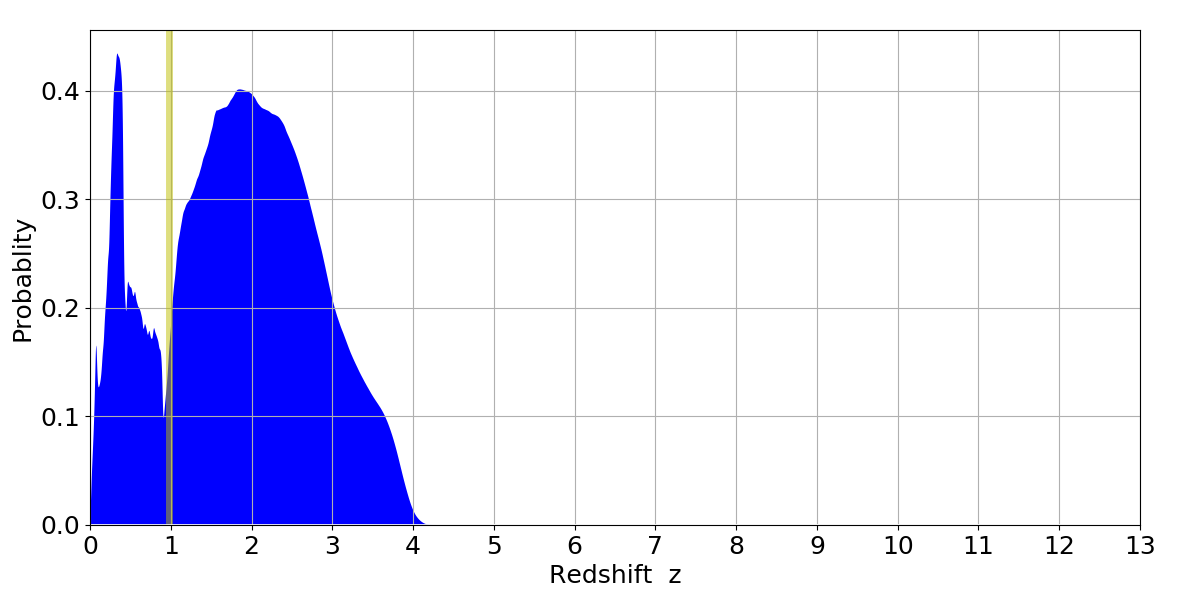
In P(z) plots: Yellow lines mark the cluster redshift z = 0.972,
Object #20131 x,y = (5393, 8498) RA, Dec = (06:15:41.520, -57:42:55.08) = (93.92300, -57.71530) BPZ = 0.339 [0.200--3.616] type = 10.50 (SB11_A_0_l - SB3_B10) chisq2 = 0.00 ODDS = 0.05 z_cluster = 0.972