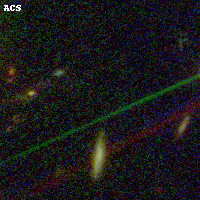
SPT0615-57 ACS+IR detection object #11560
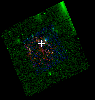
Color images and BPZ results
Catalog: 11560.cat
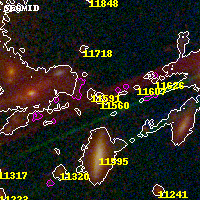
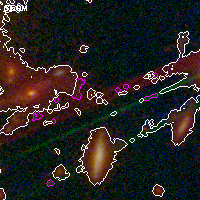
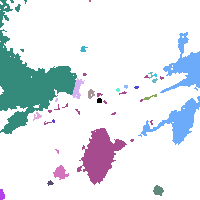
Black segments are analyzed here. Roll mouse over color images to view segments.
Best viewed in a wide browser window (1200 pixels or more). Download SED & P(z) plots to view larger versions.
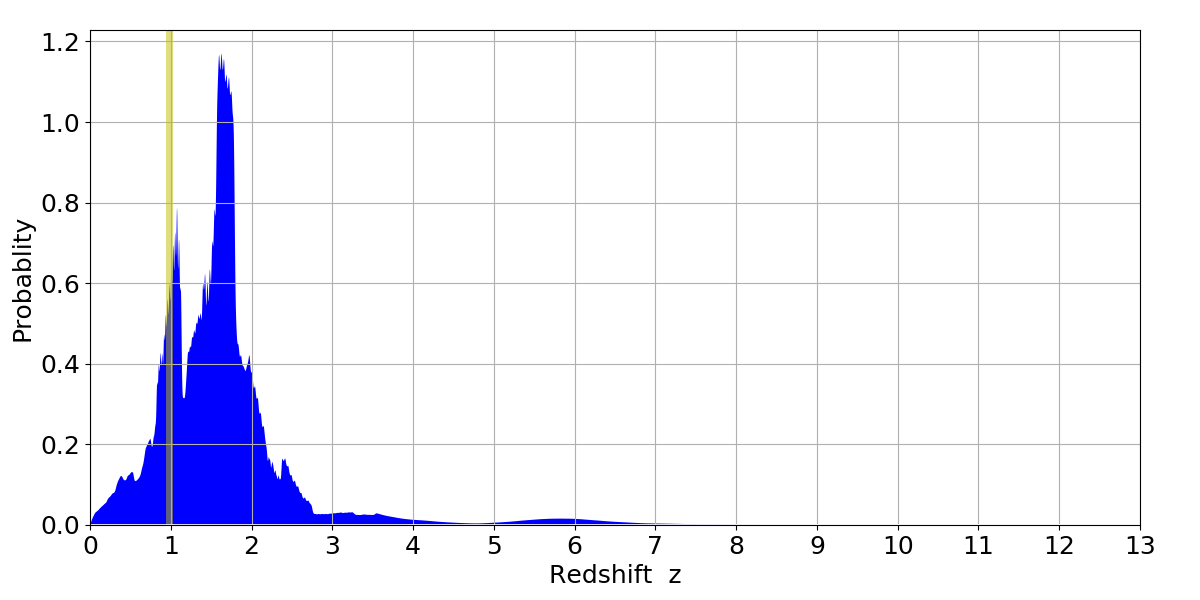
In P(z) plots: Yellow lines mark the cluster redshift z = 0.972,
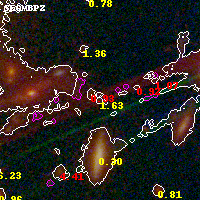
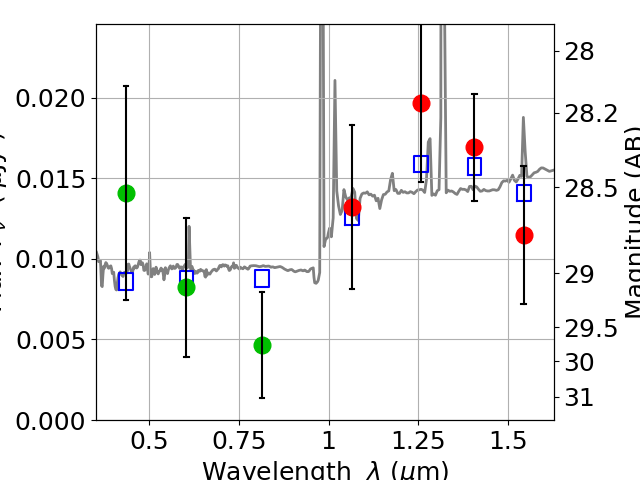
Object #11560 x,y = (3887, 5448) RA, Dec = (06:15:52.800, -57:45:58.32) = (93.97000, -57.76620) BPZ = 1.629 [0.403--4.591] type = 9.80 (SB3_B10 - SB2_B10) chisq2 = 0.79 ODDS = 0.22 z_cluster = 0.972