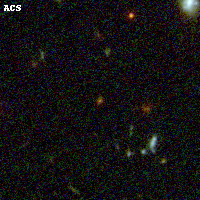
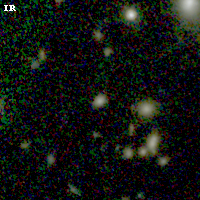
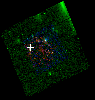
SPT0615-57 ACS+IR detection object #10083
Color images and BPZ results
Catalog: 10083.cat
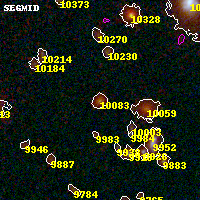
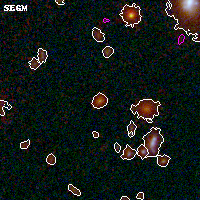
Black segments are analyzed here. Roll mouse over color images to view segments.
Best viewed in a wide browser window (1200 pixels or more). Download SED & P(z) plots to view larger versions.
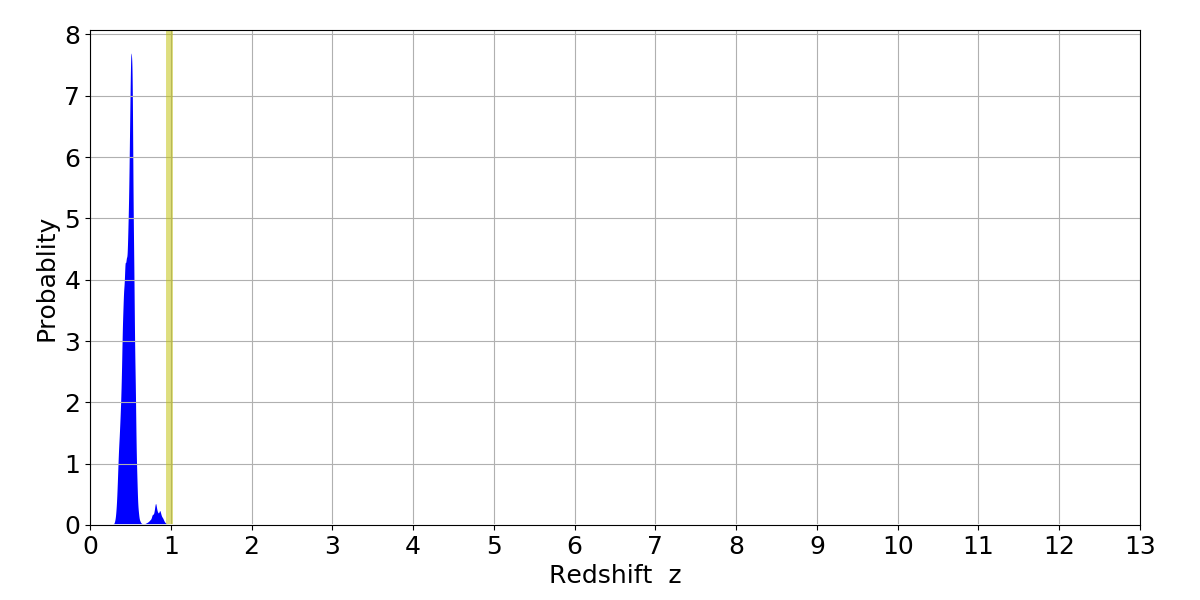
In P(z) plots: Yellow lines mark the cluster redshift z = 0.972,
Object #10083 x,y = (2877, 5030) RA, Dec = (06:16:00.384, -57:46:23.16) = (94.00160, -57.77310) BPZ = 0.515 [0.359--0.804] type = 4.00 (Ell4_A_0) chisq2 = 0.82 ODDS = 0.64 z_cluster = 0.972