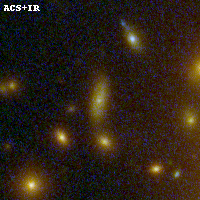
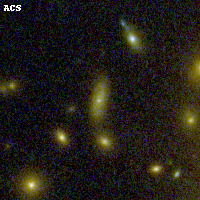
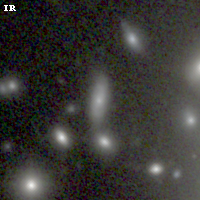
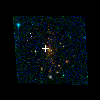
RXC2211-03 IR detection object #500
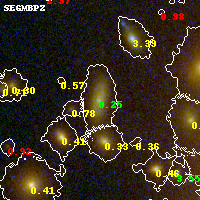
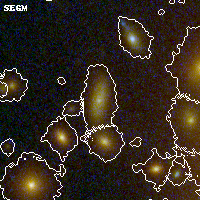
Color images and BPZ results
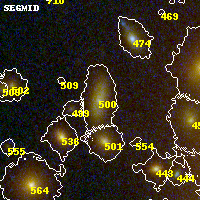
Catalog: 500.cat
Black segments are analyzed here. Roll mouse over color images to view segments.
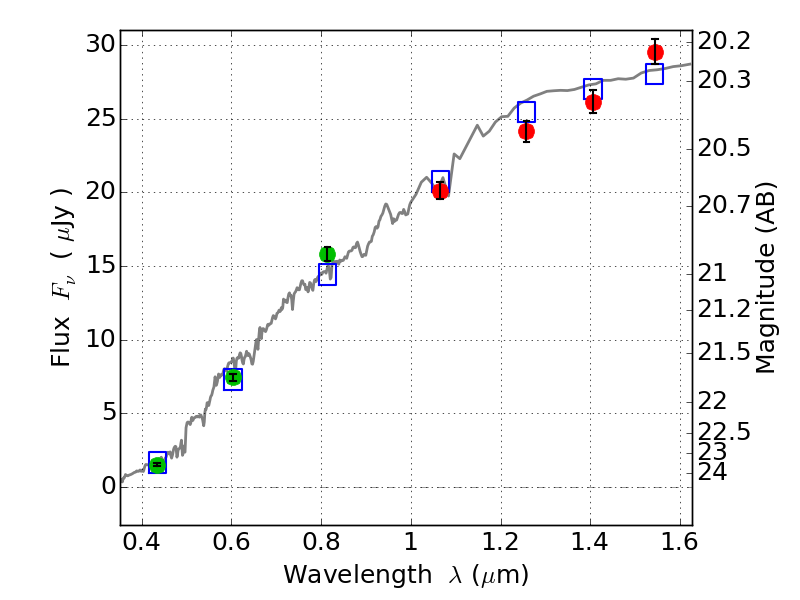
Best viewed in a wide browser window (1200 pixels or more). Download SED & P(z) plots to view larger versions.
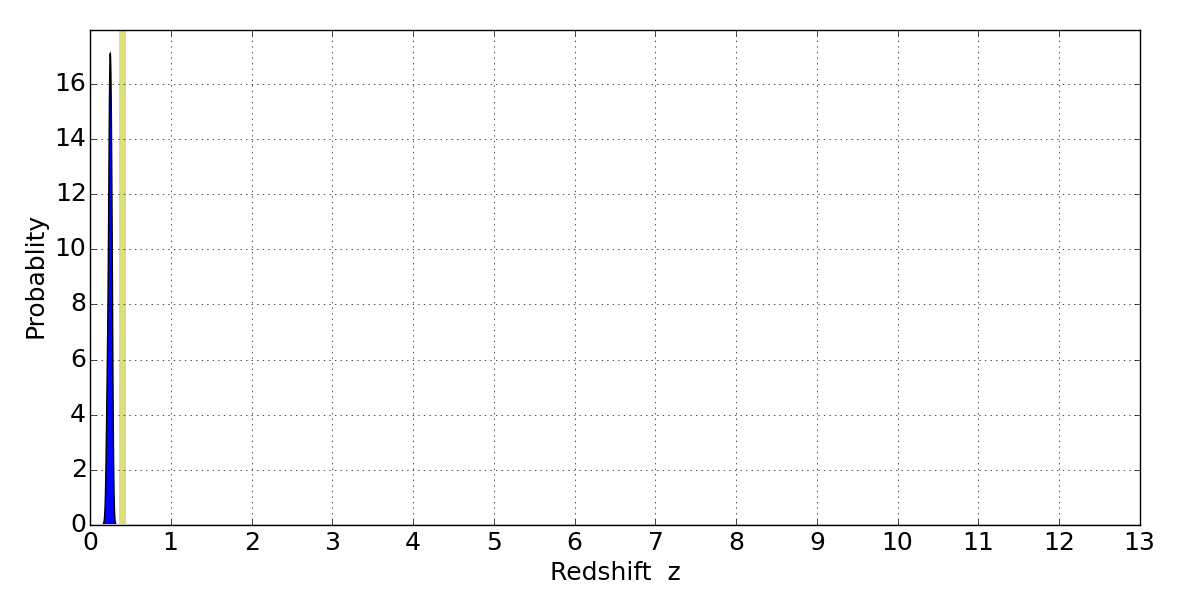
In P(z) plots: Yellow lines mark the cluster redshift z = 0.397,
Object #500 x,y = (2262, 2642) RA, Dec = (22:11:46.656, -3:49:37.20) = (332.94440, -3.82700) BPZ = 0.251 [0.199--0.289] type = 3.60 (Ell4_A_0 - Ell5_A_0) chisq2 = 0.46 ODDS = 0.97 z_cluster = 0.397