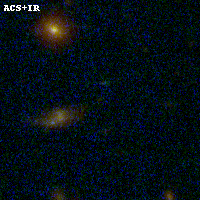
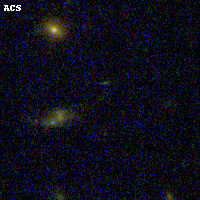
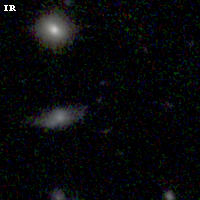
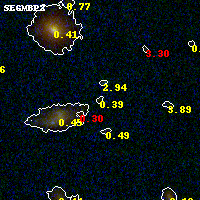
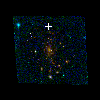
RXC2211-03 IR detection object #50
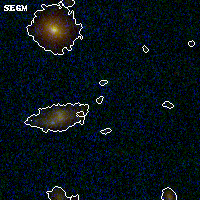
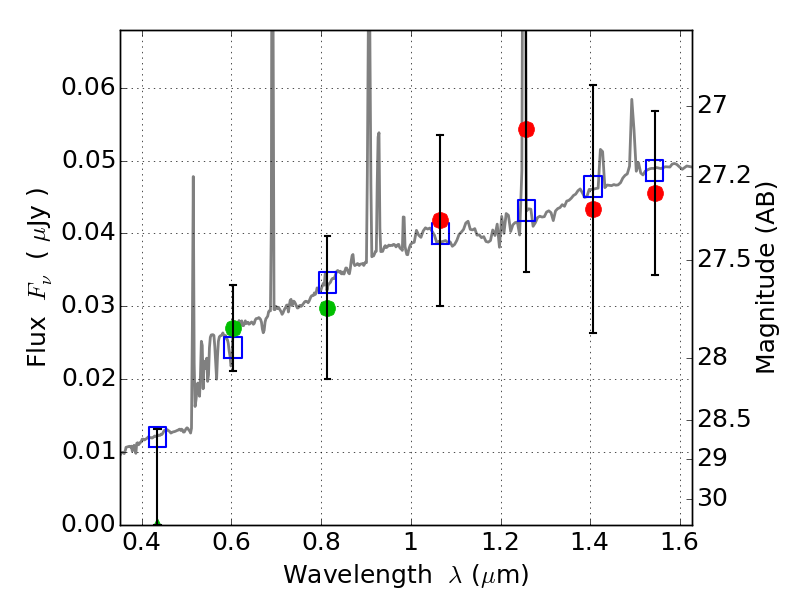
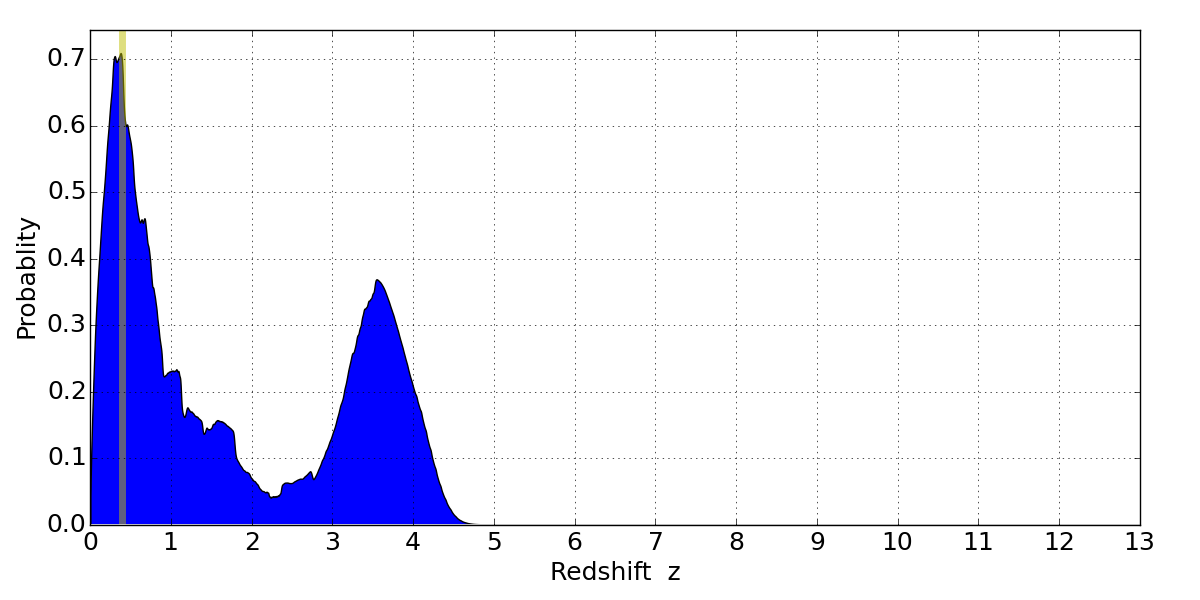
Color images and BPZ results
Catalog: 50.cat
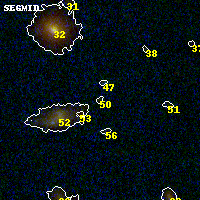
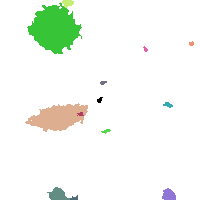
Black segments are analyzed here. Roll mouse over color images to view segments.
Best viewed in a wide browser window (1200 pixels or more). Download SED & P(z) plots to view larger versions.
In P(z) plots: Yellow lines mark the cluster redshift z = 0.397,
Object #50 x,y = (2448, 3718) RA, Dec = (22:11:45.912, -3:48:32.76) = (332.94130, -3.80910) BPZ = 0.385 [0.111--4.159] type = 8.50 (SB2_B10 - SB1_B10) chisq2 = 0.38 ODDS = 0.08 z_cluster = 0.397