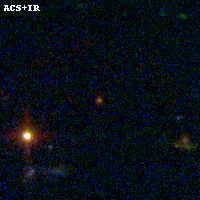
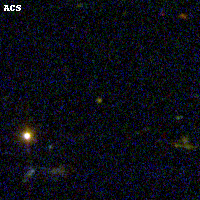
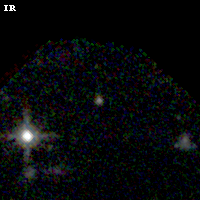
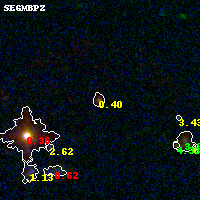
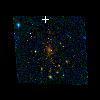
RXC2211-03 IR detection object #2
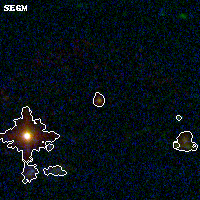
Color images and BPZ results
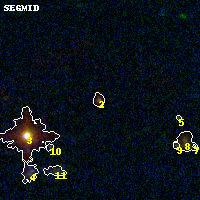
Catalog: 2.cat
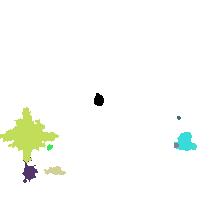
Black segments are analyzed here. Roll mouse over color images to view segments.
Best viewed in a wide browser window (1200 pixels or more). Download SED & P(z) plots to view larger versions.
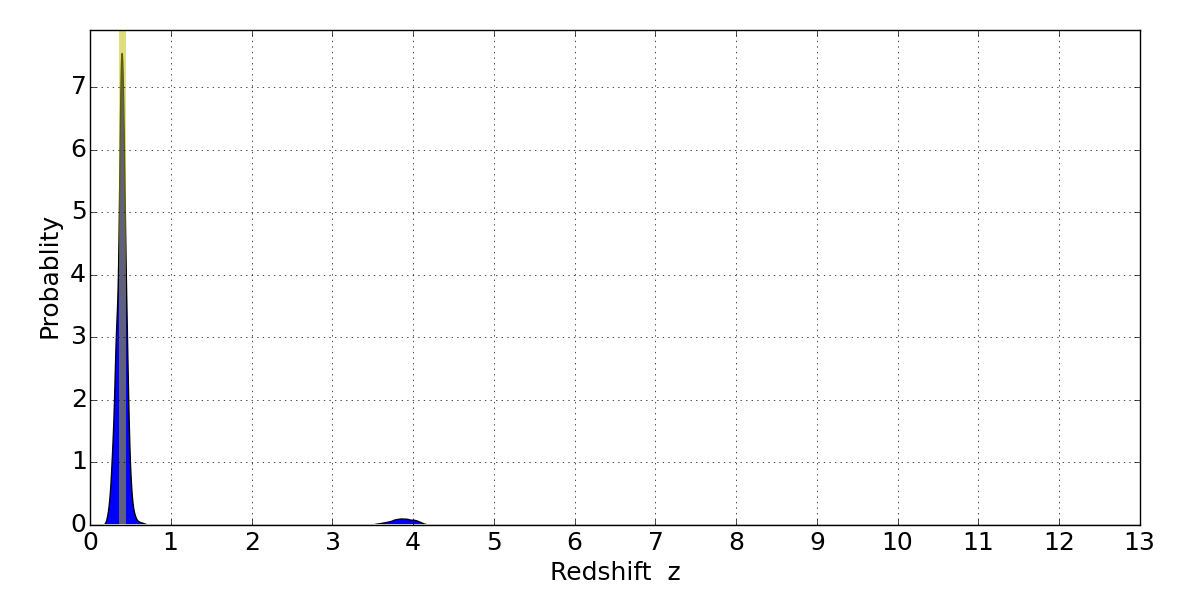
In P(z) plots: Yellow lines mark the cluster redshift z = 0.397,
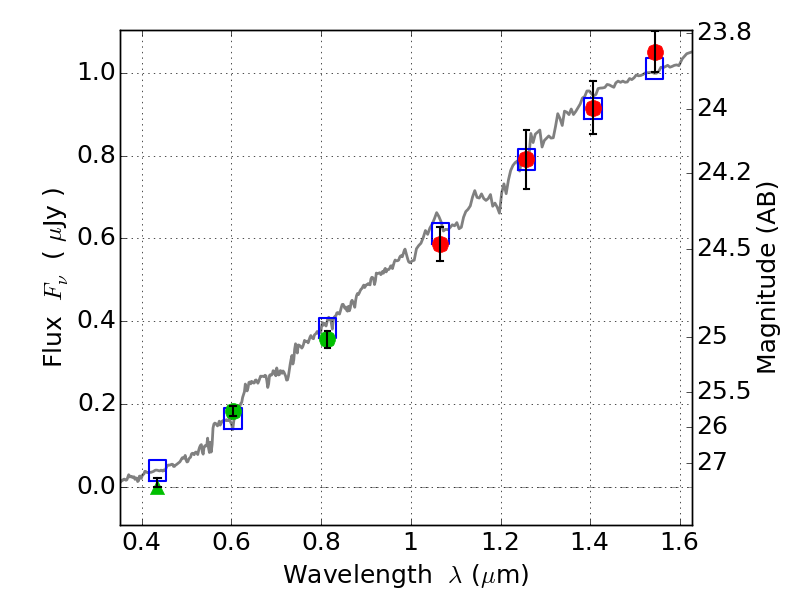
Object #2 x,y = (2256, 4051) RA, Dec = (22:11:46.680, -3:48:12.96) = (332.94450, -3.80360) BPZ = 0.397 [0.269--3.806] type = 5.50 (Sbc_B10 - ES0_B10) chisq2 = 0.22 ODDS = 0.65 z_cluster = 0.397