RXC0911+17 IR detection object #301
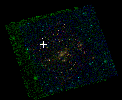
Color images and BPZ results
Catalog: 301.cat
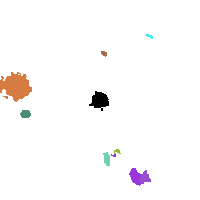
Black segments are analyzed here. Roll mouse over color images to view segments.
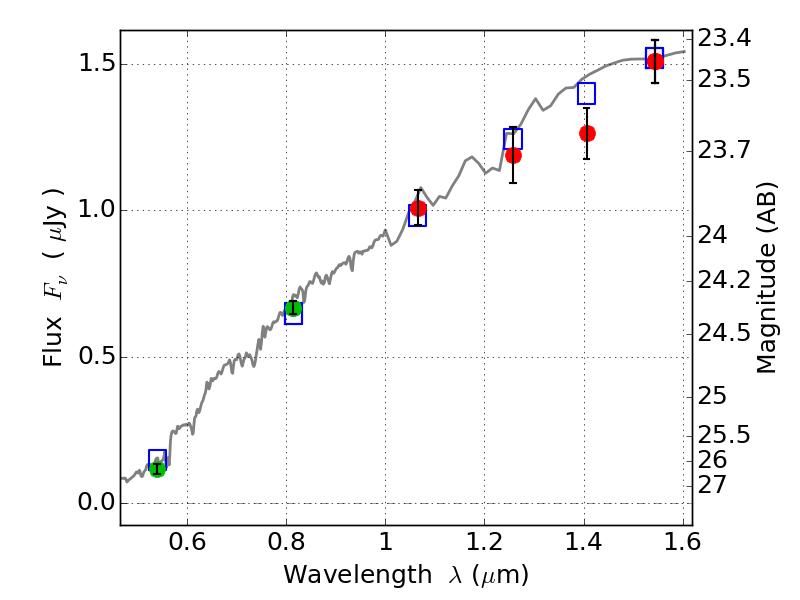
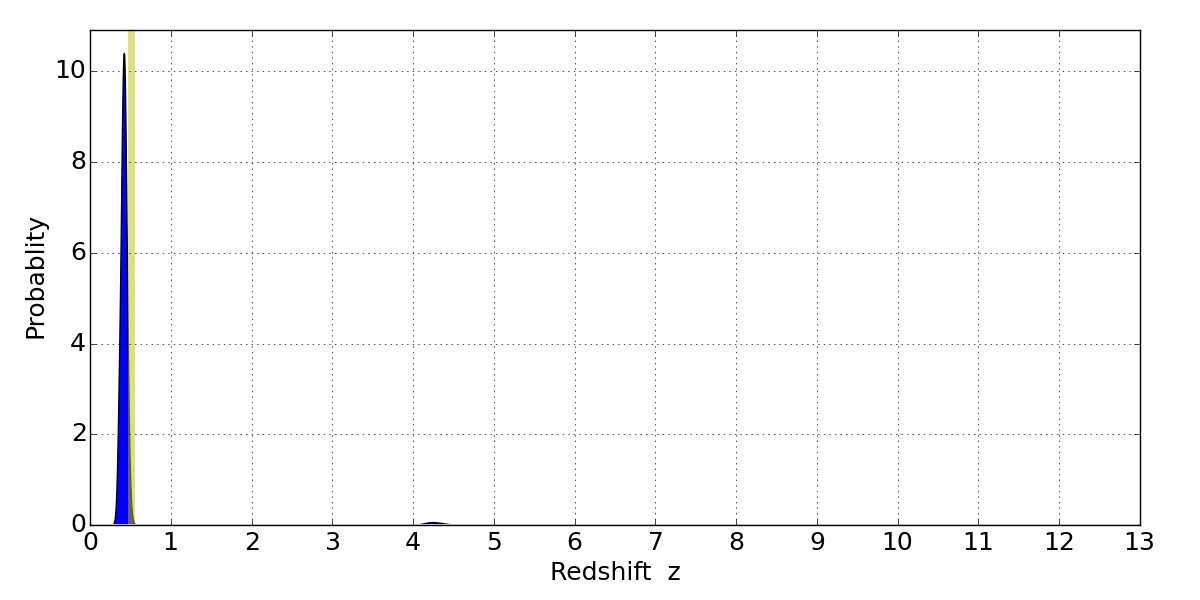
Best viewed in a wide browser window (1200 pixels or more). Download SED & P(z) plots to view larger versions.
In P(z) plots: Yellow lines mark the cluster redshift z = 0.505,
Object #301 x,y = (1968, 2550) RA, Dec = (09:11:14.832, 17:46:59.16) = (137.81180, 17.78310) BPZ = 0.425 [0.345--0.508] type = 3.50 (Ell4_A_0 - Ell5_A_0) chisq2 = 0.24 ODDS = 0.85 z_cluster = 0.505