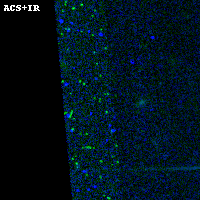
RXC0142+44 ACS+IR detection object #5300
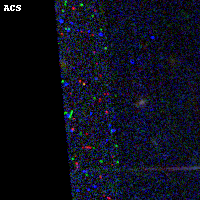
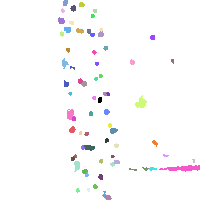
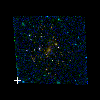
Color images and BPZ results
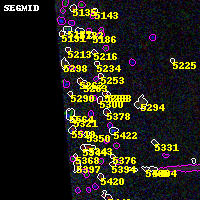
Catalog: 5300.cat
Black segments are analyzed here. Roll mouse over color images to view segments.
Best viewed in a wide browser window (1200 pixels or more). Download SED & P(z) plots to view larger versions.
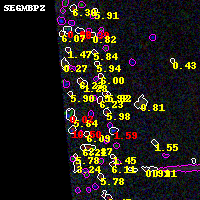
In P(z) plots: Yellow lines mark the cluster redshift z = 0.341,
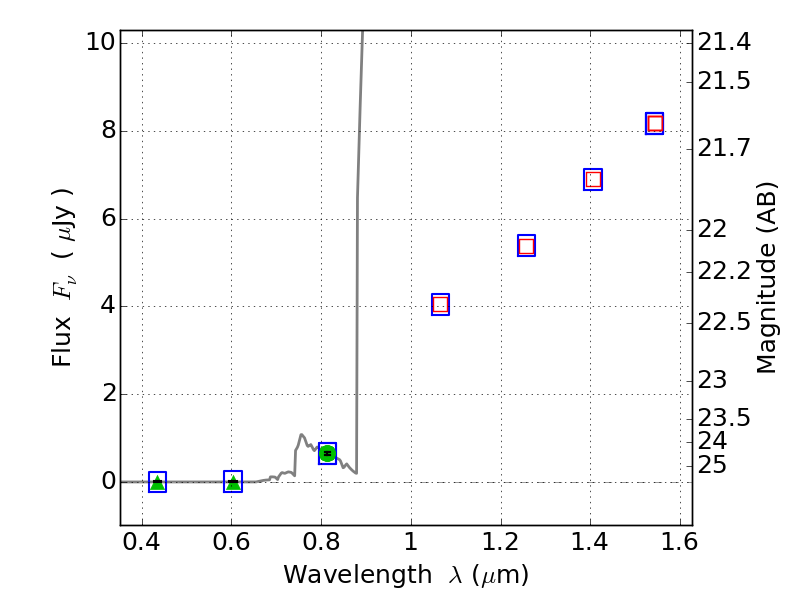
Object #5300 x,y = (893, 1000) RA, Dec = (01:43:03.840, 44:36:33.12) = (25.76600, 44.60920) BPZ = 6.234 [5.818--8.864] type = 6.00 (Sbc_B10) chisq2 = 0.00 ODDS = 0.38 z_cluster = 0.341