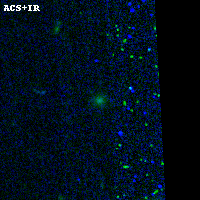
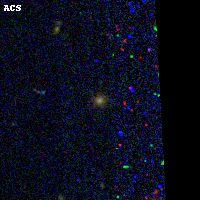
RXC0142+44 ACS+IR detection object #5030
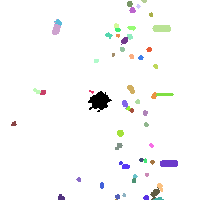
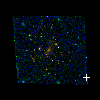
Color images and BPZ results
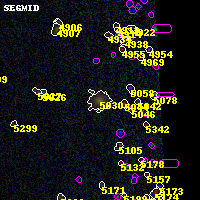
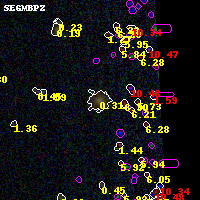
Catalog: 5030.cat
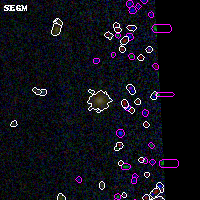
Black segments are analyzed here. Roll mouse over color images to view segments.
Best viewed in a wide browser window (1200 pixels or more). Download SED & P(z) plots to view larger versions.
In P(z) plots: Yellow lines mark the cluster redshift z = 0.341,
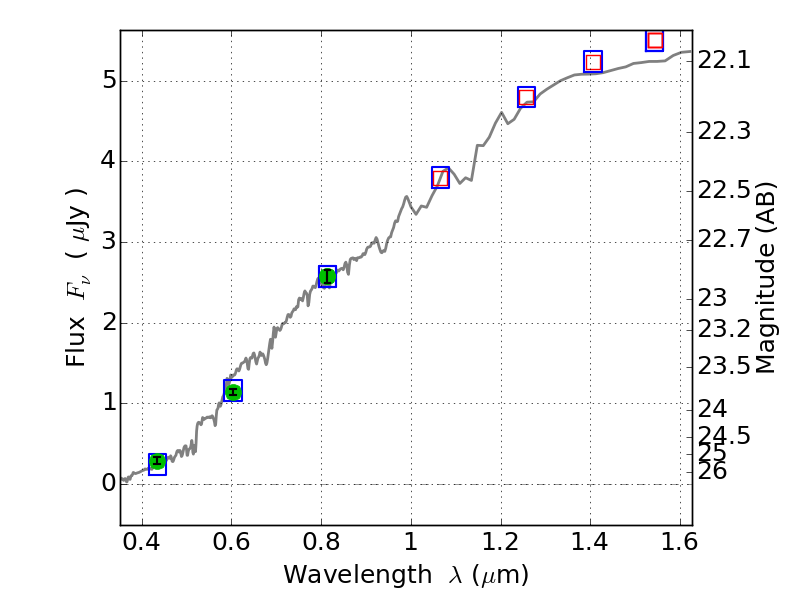
Object #5030 x,y = (4304, 1155) RA, Dec = (01:42:44.688, 44:36:42.48) = (25.68620, 44.61180) BPZ = 0.312 [0.249--0.471] type = 2.80 (Ell5_A_0 - Ell6_A_0) chisq2 = 0.02 ODDS = 0.74 z_cluster = 0.341