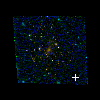
RXC0142+44 ACS+IR detection object #5013
Color images and BPZ results
Catalog: 5013.cat
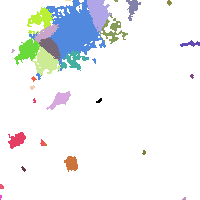
Black segments are analyzed here. Roll mouse over color images to view segments.
Best viewed in a wide browser window (1200 pixels or more). Download SED & P(z) plots to view larger versions.
In P(z) plots: Yellow lines mark the cluster redshift z = 0.341,
Object #5013 x,y = (3796, 1173) RA, Dec = (01:42:47.520, 44:36:43.56) = (25.69800, 44.61210) BPZ = 1.597 [0.172--3.109] type = 9.00 (SB2_B10) chisq2 = 0.01 ODDS = 0.09 z_cluster = 0.341