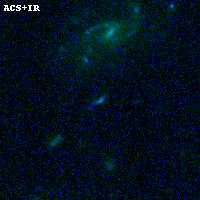
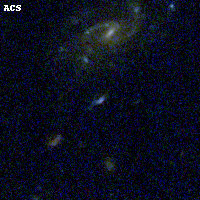
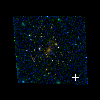
RXC0142+44 ACS+IR detection object #5000
Color images and BPZ results
Catalog: 5000.cat
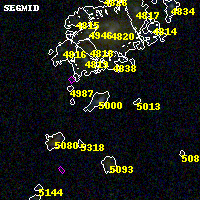
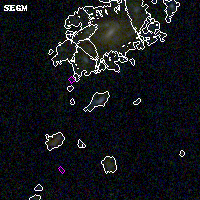
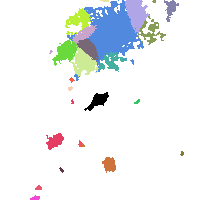
Black segments are analyzed here. Roll mouse over color images to view segments.
Best viewed in a wide browser window (1200 pixels or more). Download SED & P(z) plots to view larger versions.
In P(z) plots: Yellow lines mark the cluster redshift z = 0.341,
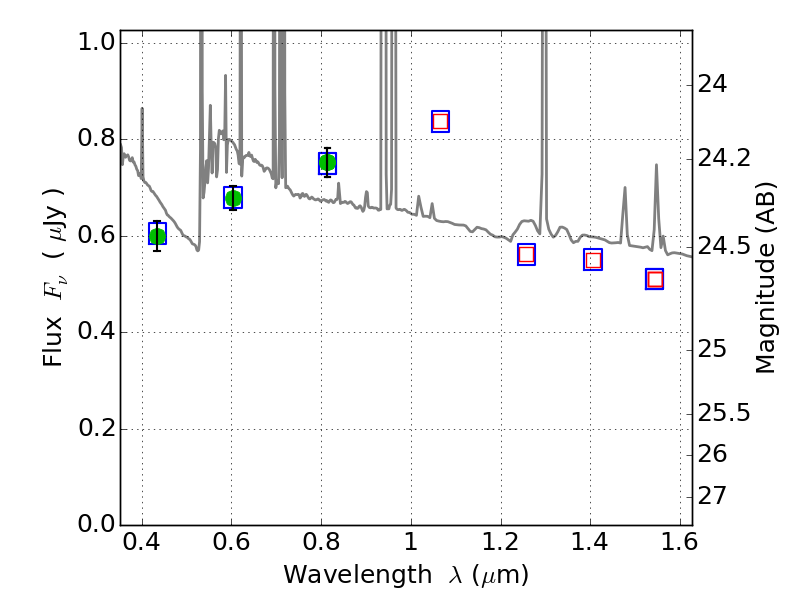
Object #5000 x,y = (3758, 1174) RA, Dec = (01:42:47.736, 44:36:43.56) = (25.69890, 44.61210) BPZ = 0.435 [0.242--2.429] type = 10.80 (SB11_A_0_l - SB3_B10) chisq2 = 0.01 ODDS = 0.12 z_cluster = 0.341