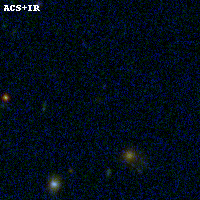
RXC0142+44 ACS+IR detection object #2009
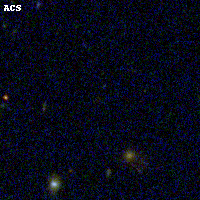
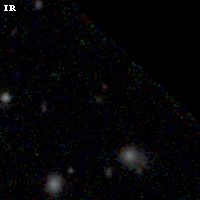
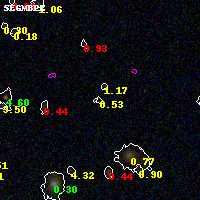
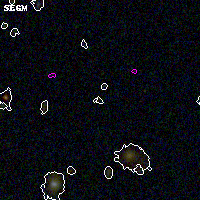
Color images and BPZ results
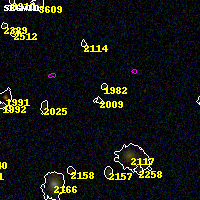
Catalog: 2009.cat
Black segments are analyzed here. Roll mouse over color images to view segments.
Best viewed in a wide browser window (1200 pixels or more). Download SED & P(z) plots to view larger versions.
In P(z) plots: Yellow lines mark the cluster redshift z = 0.341,
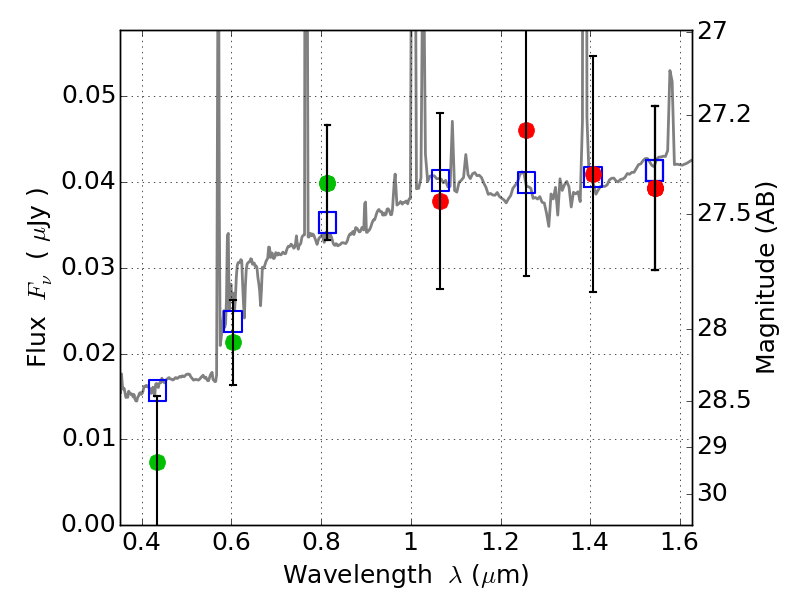
Object #2009 x,y = (3406, 2962) RA, Dec = (01:42:49.728, 44:38:30.84) = (25.70720, 44.64190) BPZ = 0.528 [0.172--4.486] type = 9.30 (SB2_B10 - SB3_B10) chisq2 = 0.34 ODDS = 0.11 z_cluster = 0.341