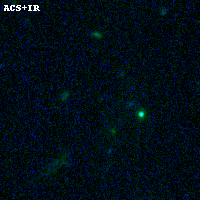
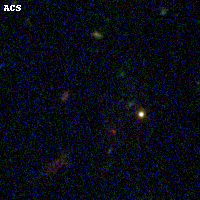
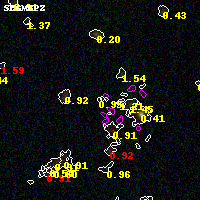
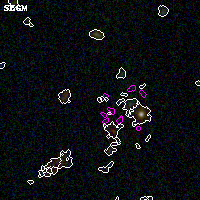
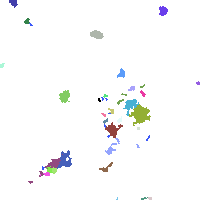
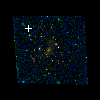
RXC0142+44 ACS+IR detection object #1051
Color images and BPZ results
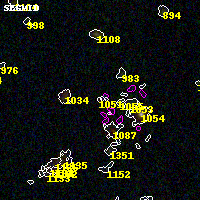
Catalog: 1051.cat
Black segments are analyzed here. Roll mouse over color images to view segments.
Best viewed in a wide browser window (1200 pixels or more). Download SED & P(z) plots to view larger versions.
In P(z) plots: Yellow lines mark the cluster redshift z = 0.341,
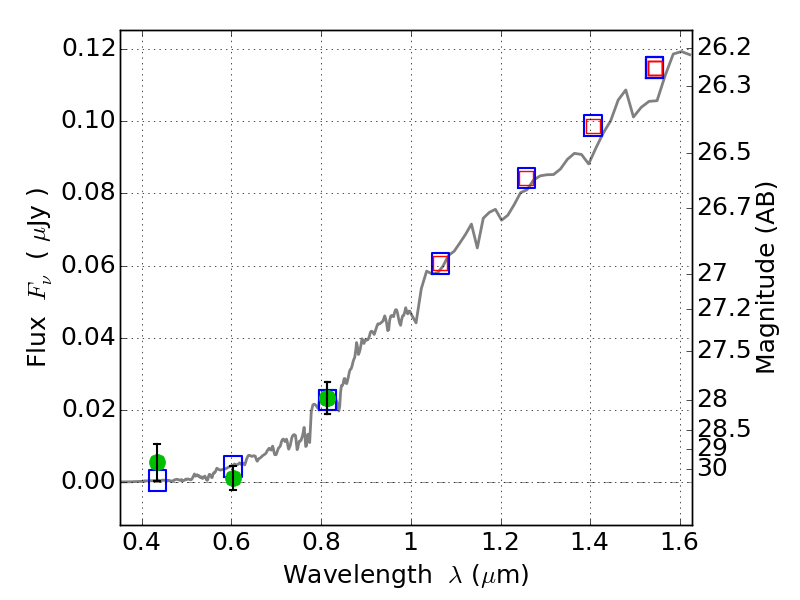
Object #1051 x,y = (1413, 3645) RA, Dec = (01:43:00.936, 44:39:11.88) = (25.75390, 44.65330) BPZ = 0.955 [0.606--8.282] type = 2.00 (Ell6_A_0) chisq2 = 0.46 ODDS = 0.07 z_cluster = 0.341